Fig. 8
Download original image
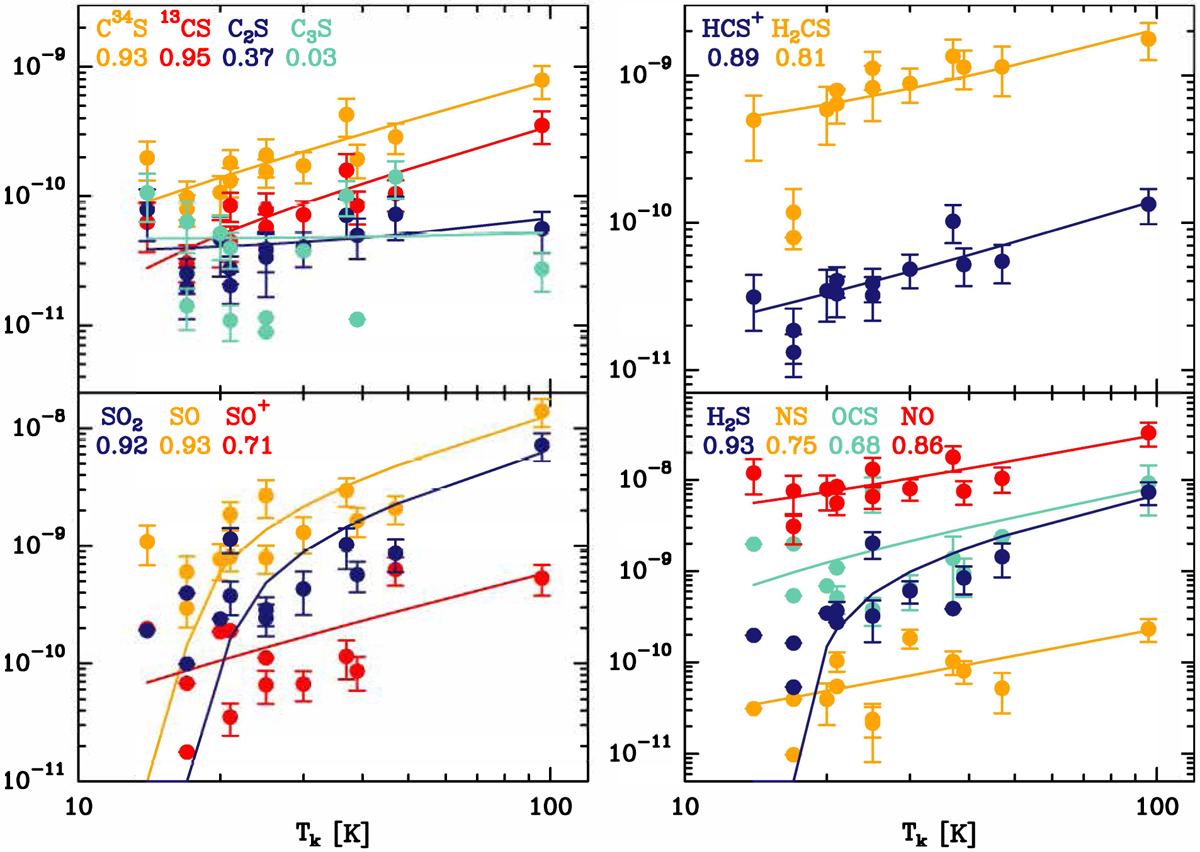
Fractional abundances as a function of the kinetic temperature. Tk is derived from ammonia (Fontani et al. 2011). The four panels show sulphur-bearing molecules that contain only carbon (top left panel); carbon and hydrogen (top right panel); only oxygen (bottom left panel); and anything else (bottom right panel). The symbols without uncertainty are upper limits. The numbers below the label of each molecule are the Pearson ρ correlation coefficient. The curves represent linear fits to the data, including the upper limits plotted in logaritmic scale.
Current usage metrics show cumulative count of Article Views (full-text article views including HTML views, PDF and ePub downloads, according to the available data) and Abstracts Views on Vision4Press platform.
Data correspond to usage on the plateform after 2015. The current usage metrics is available 48-96 hours after online publication and is updated daily on week days.
Initial download of the metrics may take a while.