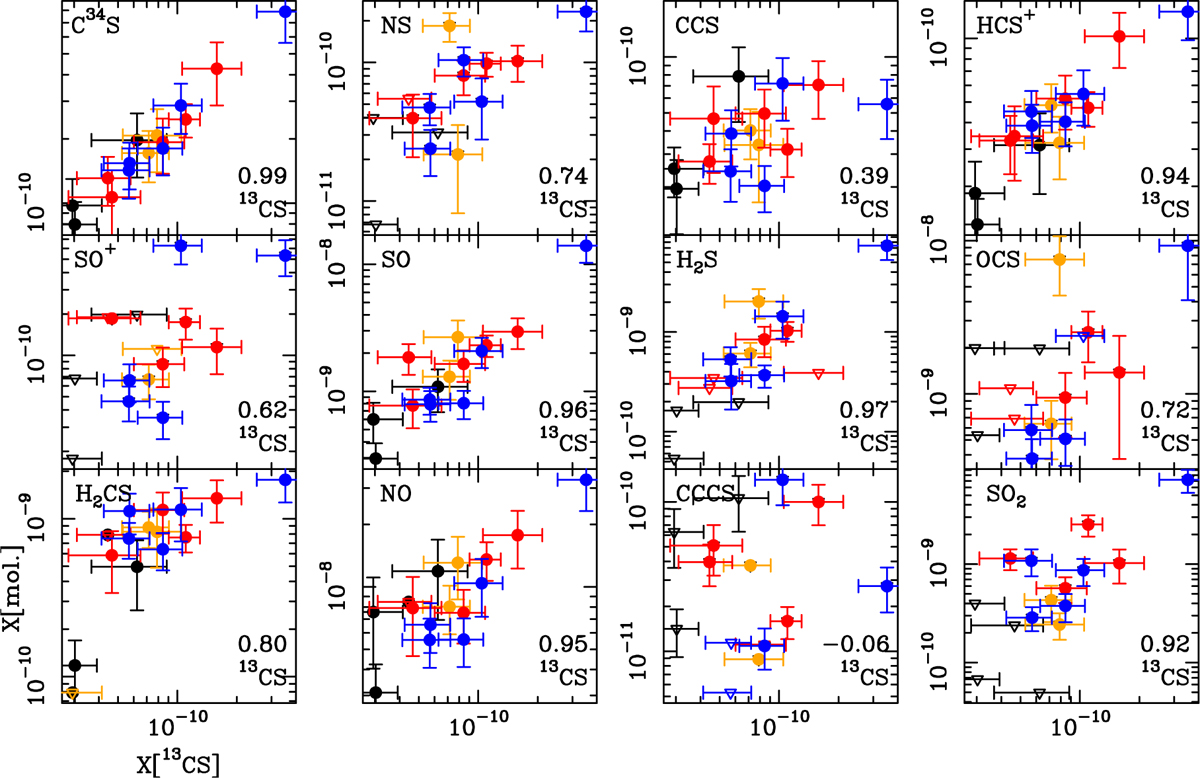
Fig. 6
Download original image
Comparison between the fractional abundances of the observed species and that of 13CS. In all plots, the black points indicate the cold HMSCs, the orange points the two warm HMSCs, the red poins the HMPOs, and the blue points the UCHII regions. The empty triangles are upper limits. The number in the lower right corner of each panel is the Pearson p correlation coefficient.
Current usage metrics show cumulative count of Article Views (full-text article views including HTML views, PDF and ePub downloads, according to the available data) and Abstracts Views on Vision4Press platform.
Data correspond to usage on the plateform after 2015. The current usage metrics is available 48-96 hours after online publication and is updated daily on week days.
Initial download of the metrics may take a while.