Fig. C.1
Download original image
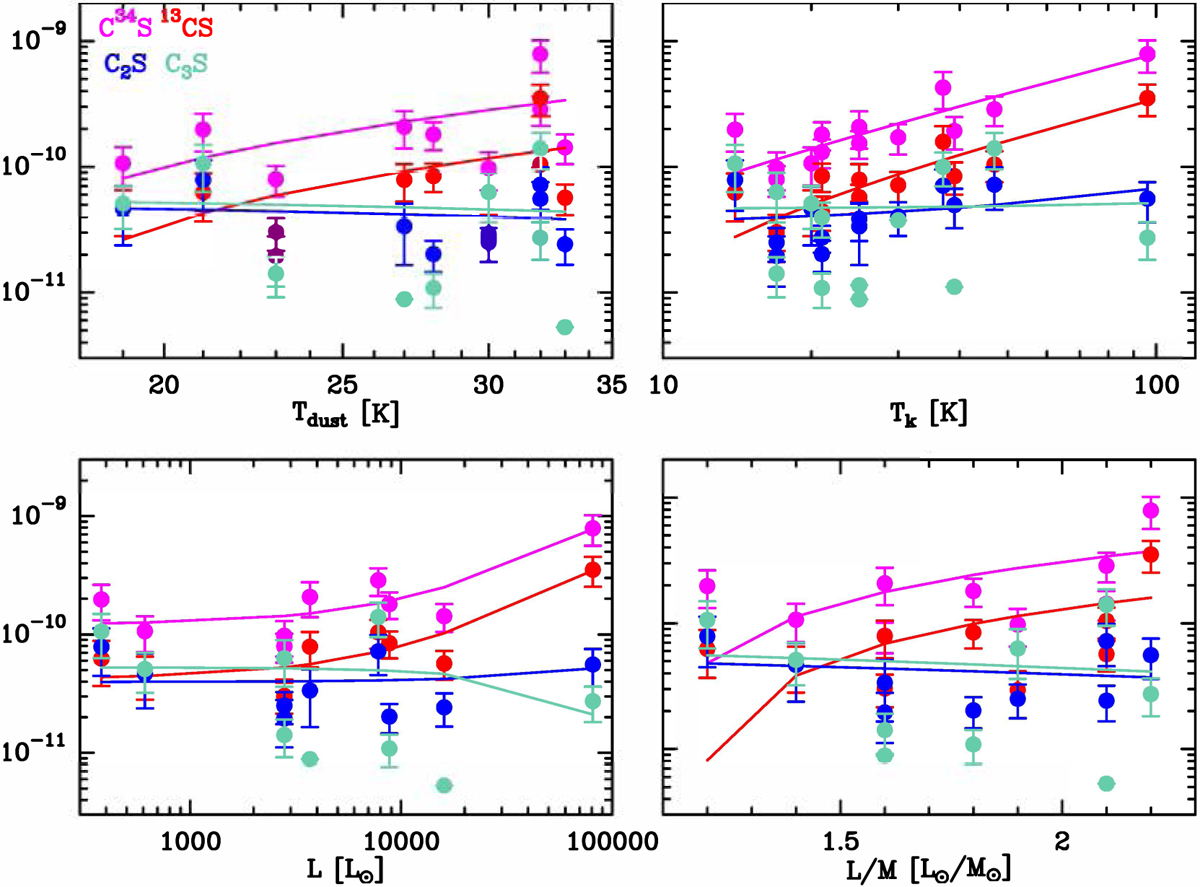
Fractional abundances as a function of evolutionary parameters. Top left panel: Measured abundances of molecules containing only sulphur and carbon as a function of the dust temperature. Td was derived by fitting the SED (Mininni et al. 2021). The symbols without uncertainty are upper limits. The curves represent linear fits to the data, including upper limits. Top right panel: Same abundances as in the top left panel as a function of the kinetic gas temperature derived from ammonia (Fontani et al. 2011); Bottom left panel: Same abundances as a function of the bolometric source luminosity derived from the SED (Mininni et al. 2021); Bottom right panel: Same abundances as a function of the luminosity-to-mass ratio (Mininni et al. 2021).
Current usage metrics show cumulative count of Article Views (full-text article views including HTML views, PDF and ePub downloads, according to the available data) and Abstracts Views on Vision4Press platform.
Data correspond to usage on the plateform after 2015. The current usage metrics is available 48-96 hours after online publication and is updated daily on week days.
Initial download of the metrics may take a while.