Open Access
Fig. A.1
Download original image
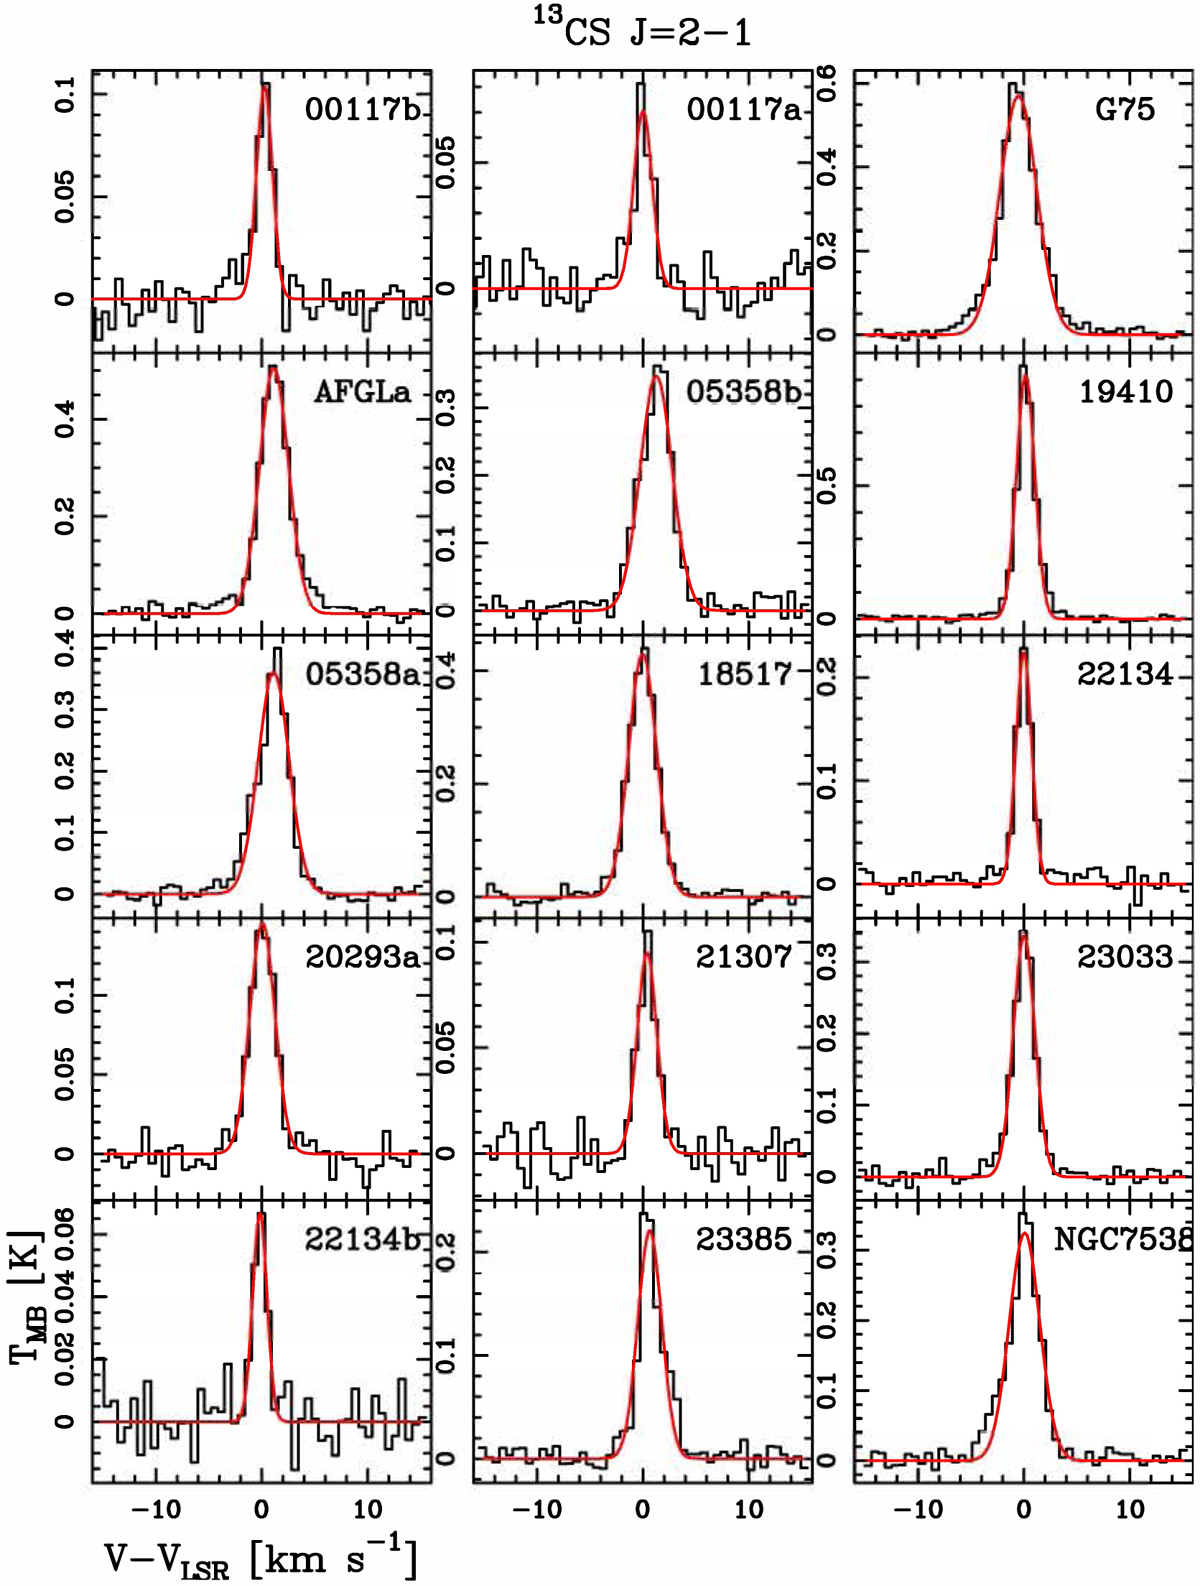
Spectra of the 13CS J = 2 − 1 lines. On the x-axis, we show the velocity shift from the systemic velocity VLSR listed in Table 1. In each frame, the red curve represents the best Gaussian fit performed with MADCUBA (see Sect. 2.3). The first column contains the HMSCs, the second the HMPOs, and the third the UCHIIs.
Current usage metrics show cumulative count of Article Views (full-text article views including HTML views, PDF and ePub downloads, according to the available data) and Abstracts Views on Vision4Press platform.
Data correspond to usage on the plateform after 2015. The current usage metrics is available 48-96 hours after online publication and is updated daily on week days.
Initial download of the metrics may take a while.