Fig. 1
Download original image
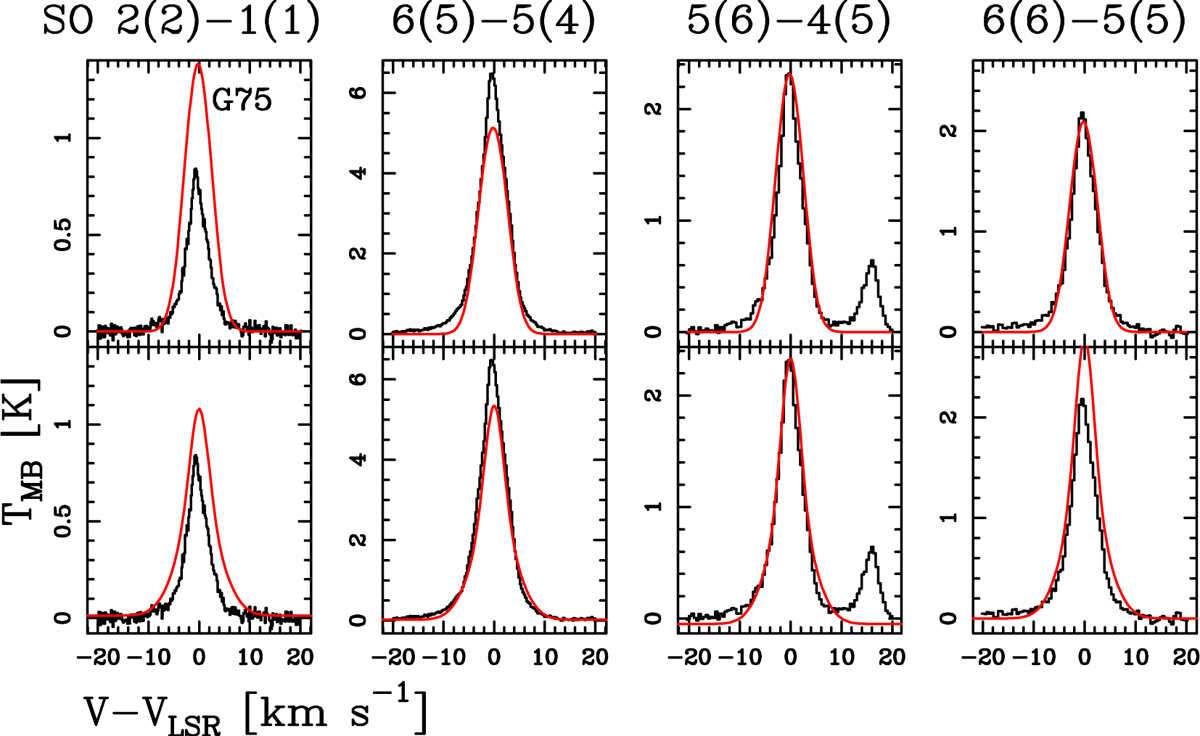
Best fit to the SO lines towards the UCHII G75. On the x-axis, we show the velocity shift from the systemic velocity VLSR listed in Table 1. The red curves superimposed on the observed spectrum (in black) represent the best fit with one Gaussian component in the upper panels, and with two Gaussian components in the lower panels.
Current usage metrics show cumulative count of Article Views (full-text article views including HTML views, PDF and ePub downloads, according to the available data) and Abstracts Views on Vision4Press platform.
Data correspond to usage on the plateform after 2015. The current usage metrics is available 48-96 hours after online publication and is updated daily on week days.
Initial download of the metrics may take a while.