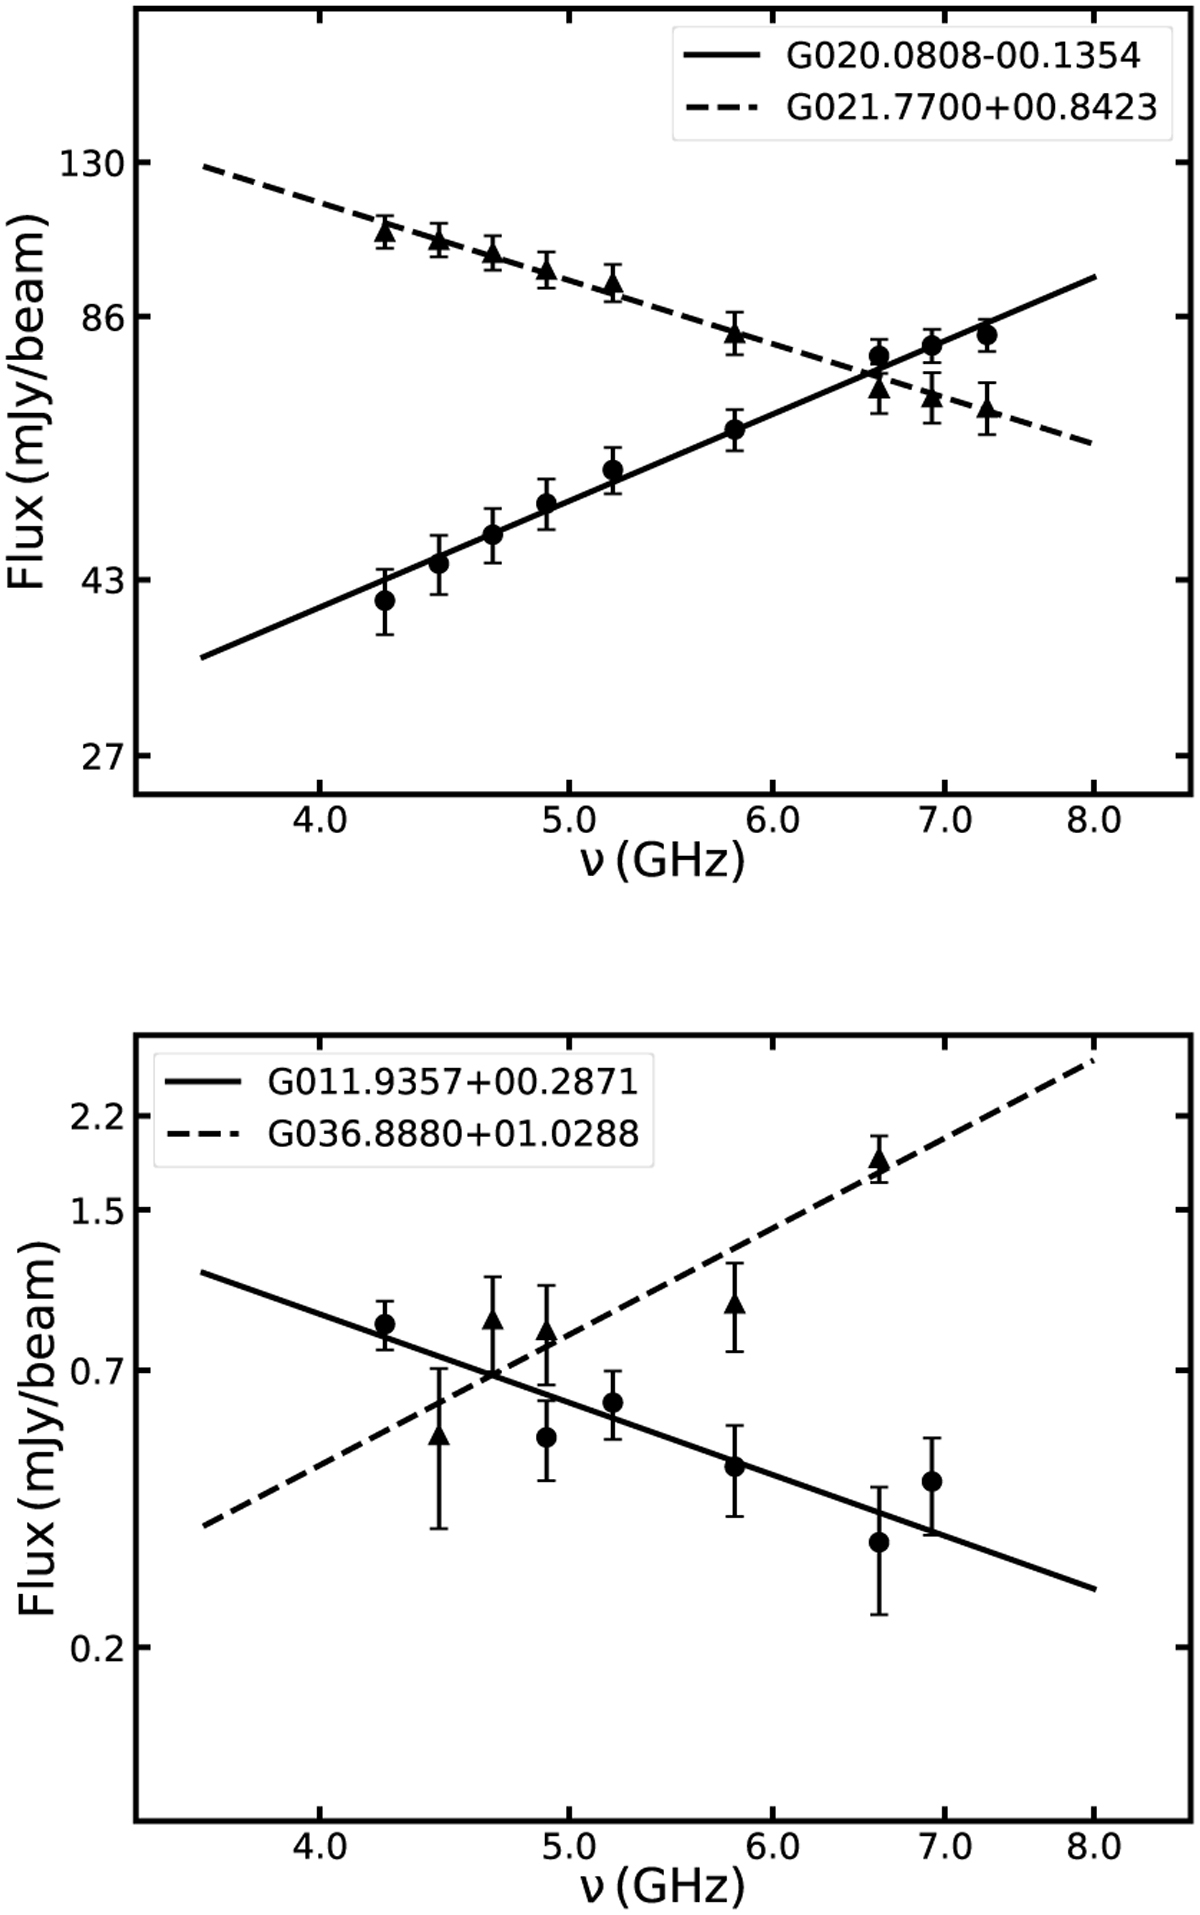
Fig. 6
Download original image
Example of the peak flux as a function of the in-band frequency for bright sources (top panel) and faint sources (bottom panel). Each data point (circle or triangle) refers to the peak intensity at each sub-band, with the error of the peak measurement. The solid and dashed lines in the top panel show the best fit to the peak flux densities from 9 sub-bands for two bright sources: G020.0808−00.1354 (α = 1.1 ± 0.07) and G021.7700+00.8423 (α = −0.92 ± 0.04), respectively. The solid and dashed lines in the bottom panel present the spectral fitting of 5 and 6 sub-bands for two faint sources: GOll.9357+00.2871 (α = −1.7 ± 0.36) and G036.8880+01.0288 (α = 2.5 ± 0.6), respectively.
Current usage metrics show cumulative count of Article Views (full-text article views including HTML views, PDF and ePub downloads, according to the available data) and Abstracts Views on Vision4Press platform.
Data correspond to usage on the plateform after 2015. The current usage metrics is available 48-96 hours after online publication and is updated daily on week days.
Initial download of the metrics may take a while.