Fig. 4
Download original image
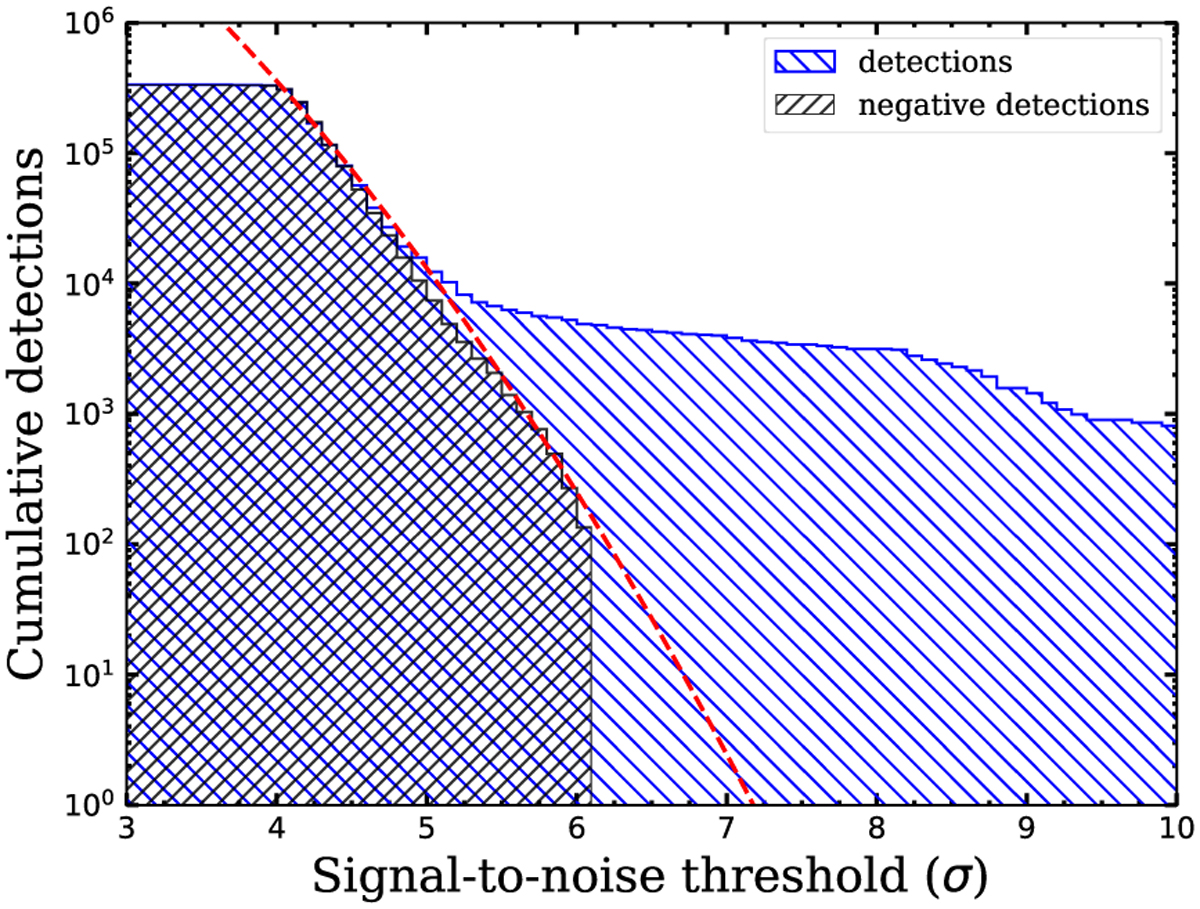
Cumulative distribution of spurious sources (black histogram) and all detections (blue histogram) as a function of the S/N (1σ ~ 0.08 mJy), to estimate the spurious sources expected in the GLOSTAR survey. The red dashed line fitted to the negative detections indicates the expected spurious sources. Below 4.5 σ, the detections are dominated by spurious sources (occupying 93%) and the false detections decrease to 186 at 6.1 σ. Above 7 σ, fewer than 5 sources are expected to be false.
Current usage metrics show cumulative count of Article Views (full-text article views including HTML views, PDF and ePub downloads, according to the available data) and Abstracts Views on Vision4Press platform.
Data correspond to usage on the plateform after 2015. The current usage metrics is available 48-96 hours after online publication and is updated daily on week days.
Initial download of the metrics may take a while.