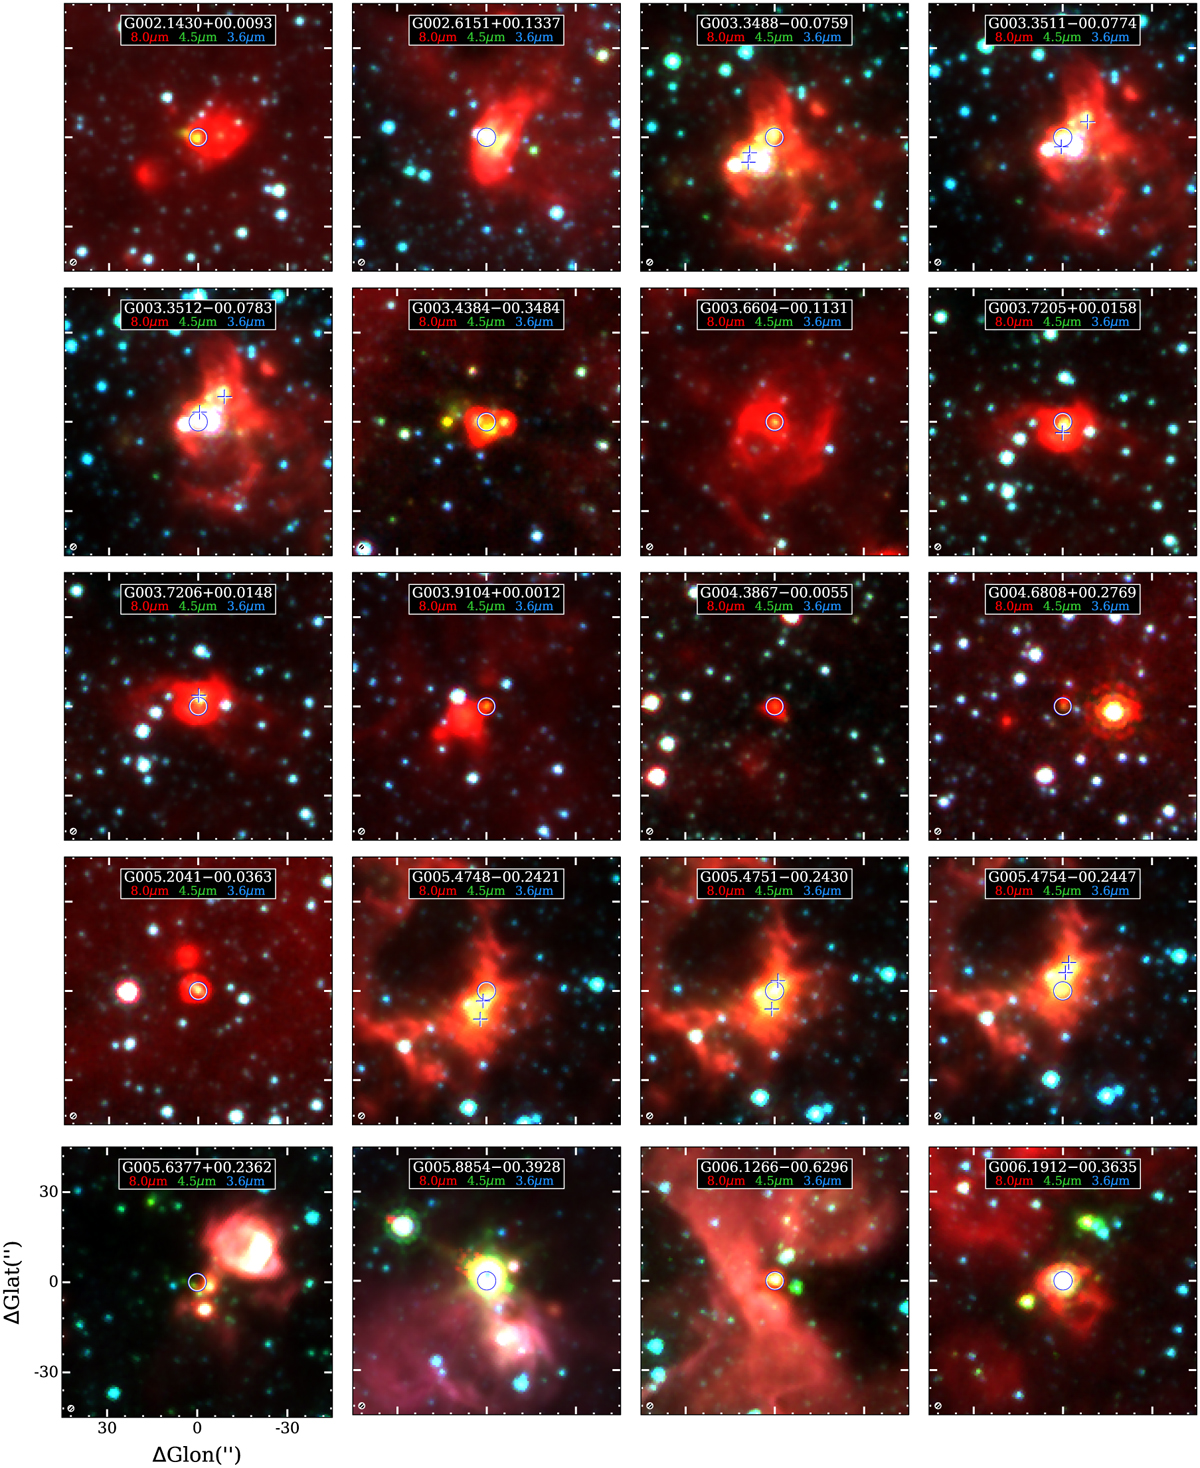
Fig. C.1
Download original image
Three colors images (red=8.0 µm, green=4.5 µm, and blue=3.6 µm) of the H II region candidates identified in this work. Each figure is centered at the position of the identified H II region candidate that is shown in blue-white circles. The images are shown in the boxes with a size of 90″ × 90″. The blue-white pluses refer to the positions of the fragmented H II regions listed in Table 4 or the nearby compact H II regions. The beam size of 1″.0 is shown in the lower-left of each image. Only a small portion of the sample is presented here, and the MIR images for the full sample of 251 H II region candidates are available in electronic form at the Zenodo via https://zenodo.org/uploads/8054107.
Current usage metrics show cumulative count of Article Views (full-text article views including HTML views, PDF and ePub downloads, according to the available data) and Abstracts Views on Vision4Press platform.
Data correspond to usage on the plateform after 2015. The current usage metrics is available 48-96 hours after online publication and is updated daily on week days.
Initial download of the metrics may take a while.