Fig. 2
Download original image
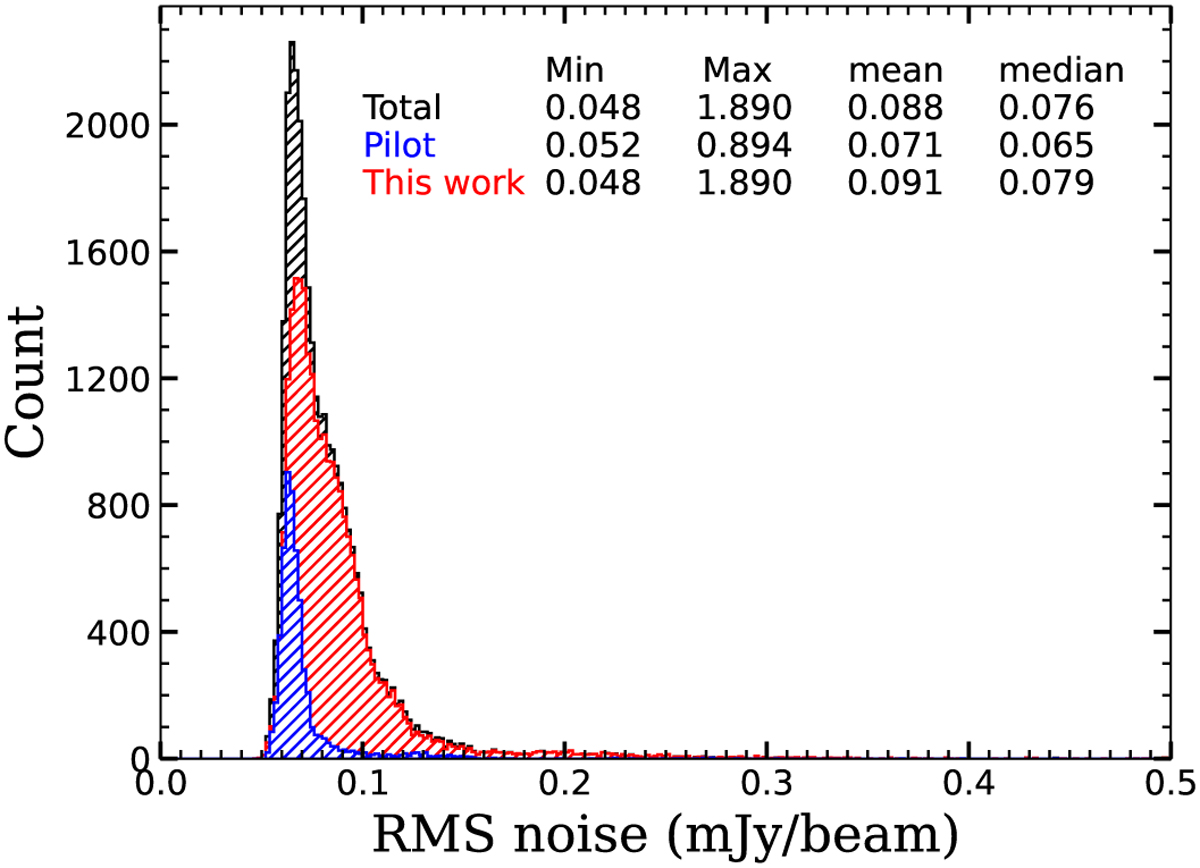
Distributions of RMS noise level of the GLOSTAR B-configuration images (Fig. 1). The bin width is 0.002 mly beam−1. The red, blue and black histograms represent values determined for the region discussed here (2° < ℓ < 28°, 36° < ℓ < 40°, and 56° < ℓ < 60°), the pilot region (28° < ℓ < 36°) published in Dzib et al. (2023), and the combined area 2° < ℓ < 40°, 56° < ℓ < 60° area. The median RMS noise level is ~ 0.08 mJy beam−1 and 95% of the fields have a noise level < 0.13 mJy beam−1.
Current usage metrics show cumulative count of Article Views (full-text article views including HTML views, PDF and ePub downloads, according to the available data) and Abstracts Views on Vision4Press platform.
Data correspond to usage on the plateform after 2015. The current usage metrics is available 48-96 hours after online publication and is updated daily on week days.
Initial download of the metrics may take a while.