Fig. 18
Download original image
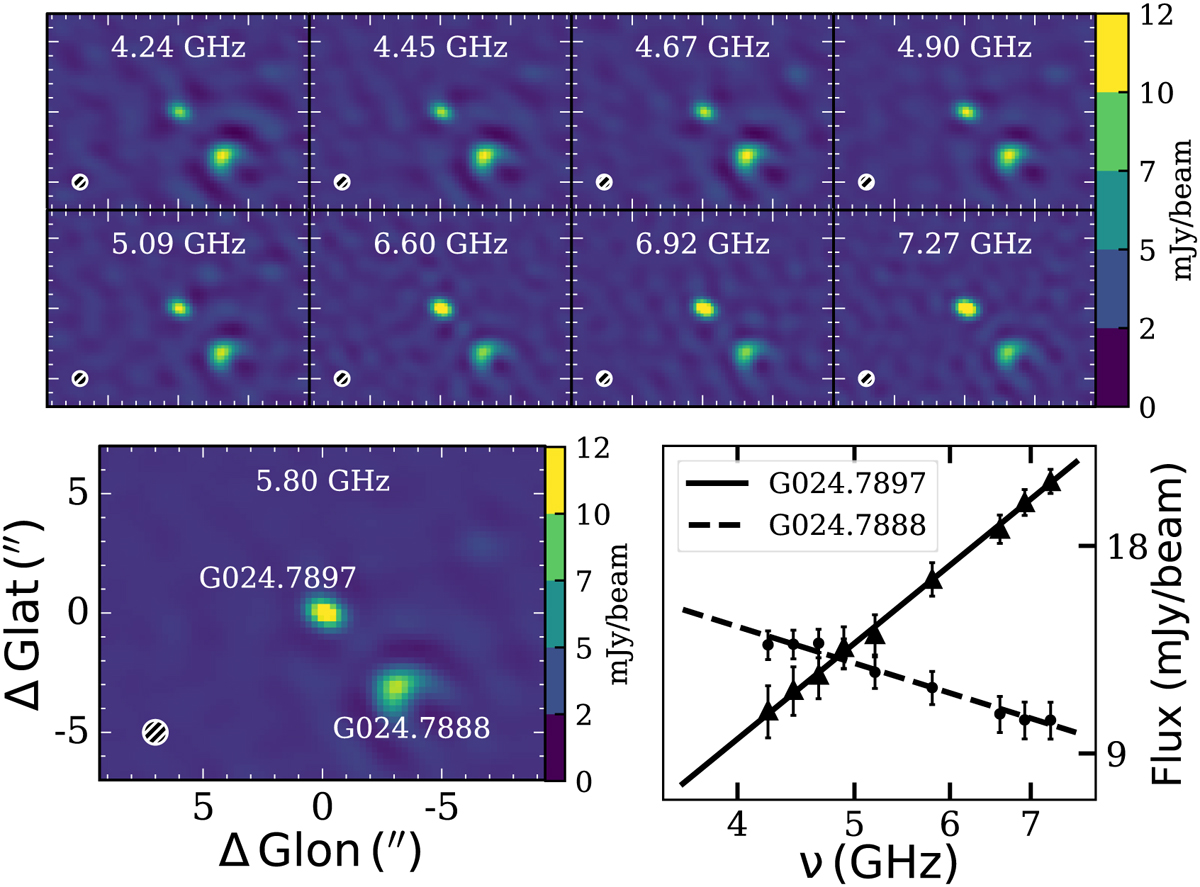
Example of two H II region candidates with positive and negative in-band spectral index, as discussed in Sect. 5.2. The top two rows show the 8 sub-bands of the GLOSTAR image. The bottom-left panel shows the averaged image at 5.8 GHz used to extract the source, and the bottom-right panel shows the in-band spectral index fitting for the two compact H II regions candidates: the solid line for G024.7897 (Yfactor = 1.02) with α = 1.43 ± 0.02 and the dashed line for G024.7888 (Yfactor = 1.97) with α = −0.55 ± 0.04. The FWHM beam of GLOSTAR in B-configuration (1.0″) is indicated by the white circles in the lower-left corner of each image. There is a clear trend that the fluxes increase and decrease as the increasing frequencies in the sub-bands for G024.7897 and G024.7888 respectively.
Current usage metrics show cumulative count of Article Views (full-text article views including HTML views, PDF and ePub downloads, according to the available data) and Abstracts Views on Vision4Press platform.
Data correspond to usage on the plateform after 2015. The current usage metrics is available 48-96 hours after online publication and is updated daily on week days.
Initial download of the metrics may take a while.