Fig. 17
Download original image
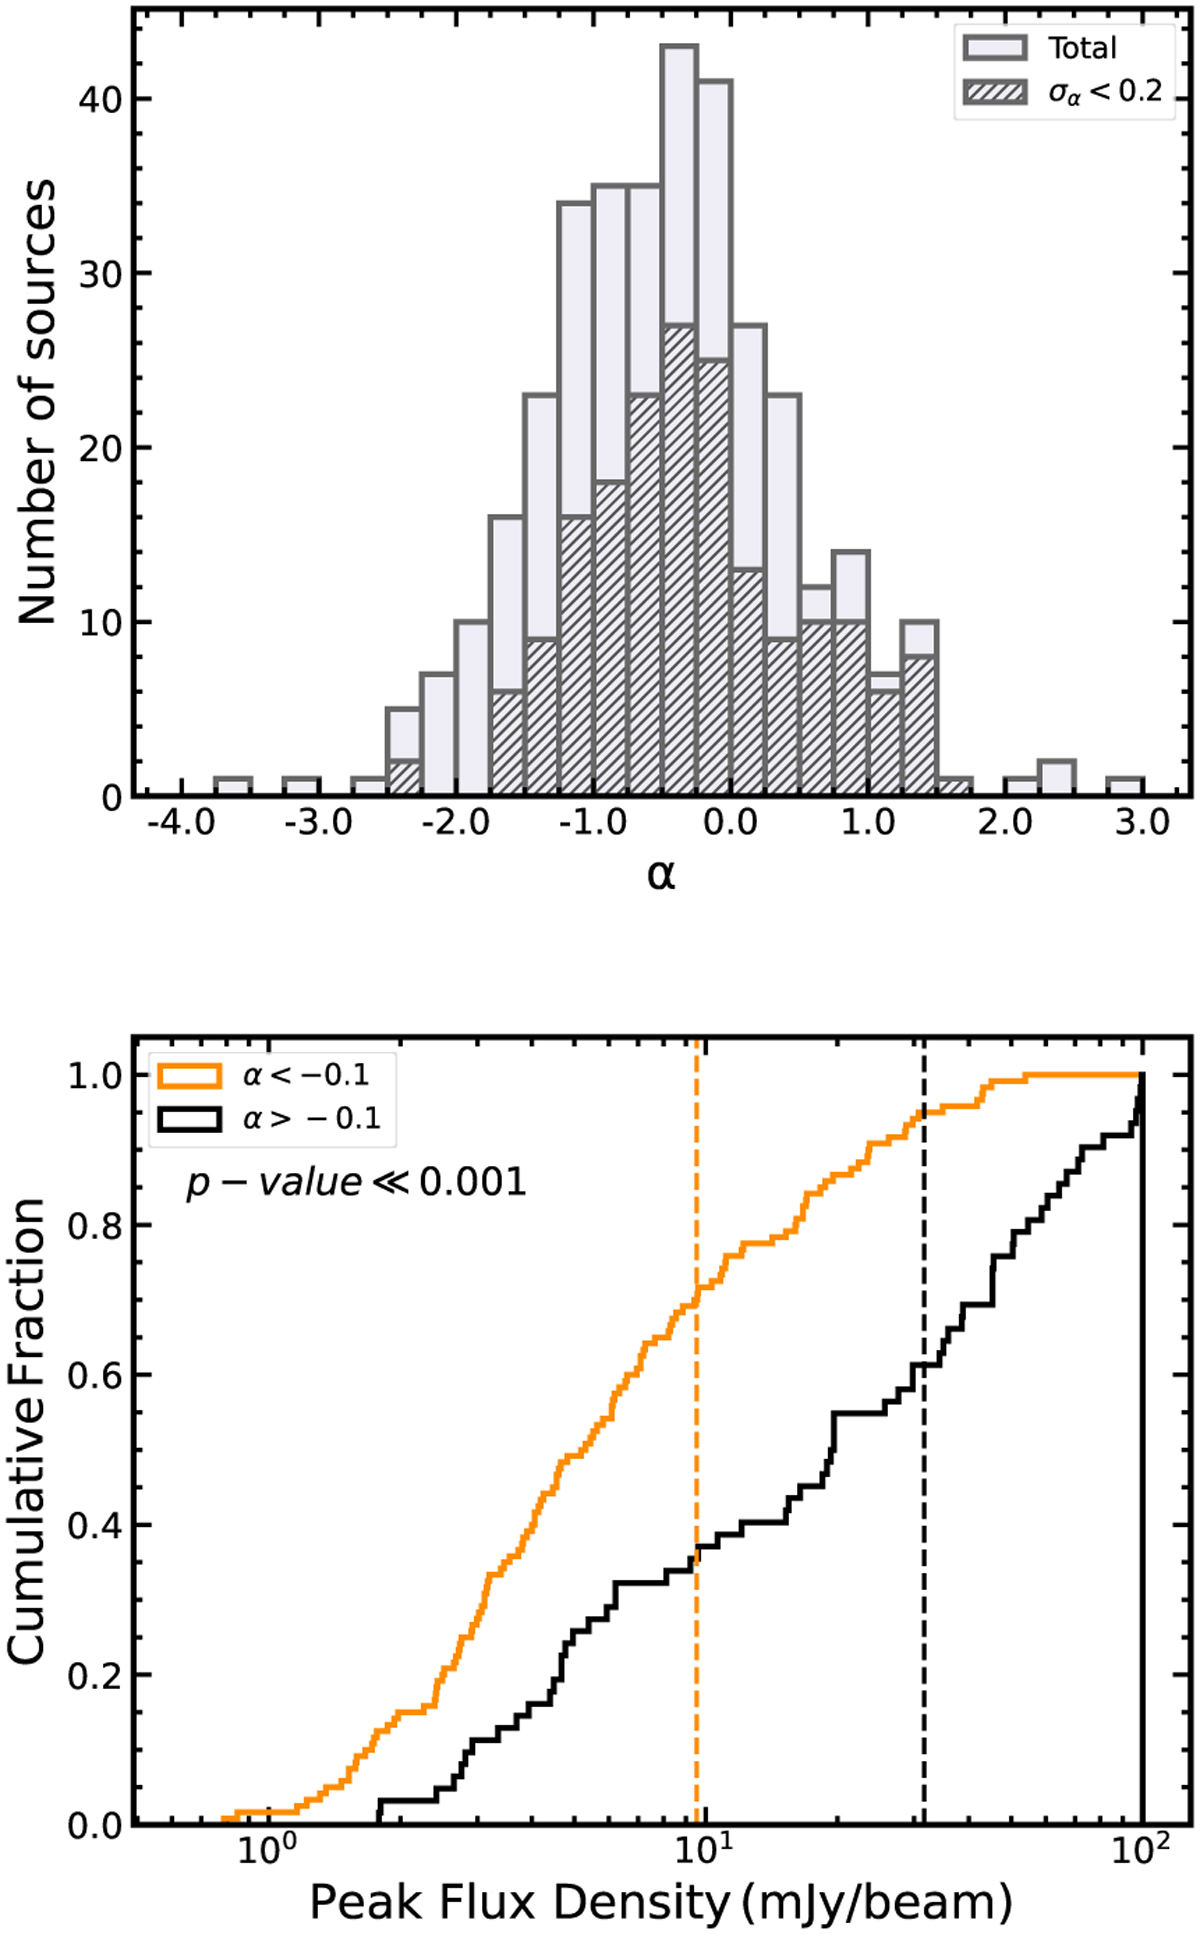
Distributions of spectral index and peak flux densities of HII region candidates in GLOSTAR B-configuration. Top panel: the histogram of the measured spectral index for the total 390 H II region candidates of GLOSTAR B-configuration. The hatched histogram represents the 183 candidates with σα < 0.2. The bin size is 0.25. The 183 candidates are divided into two subsamples: (1) 120 H II regions with α and (2) 63 H II regions with α > −0.1, indicating non-thermal and thermal emissions, respectively. Bottom panel: the cumulative distribution of the peak flux densities for the α < −0.1 sample (orange line) and the α > −0.1 sample (black line). The orange and black vertical dashed lines show the mean values of 9.5 mJy beam−1 and 31.6 mJy beam−1 for the two subsamples, respectively.
Current usage metrics show cumulative count of Article Views (full-text article views including HTML views, PDF and ePub downloads, according to the available data) and Abstracts Views on Vision4Press platform.
Data correspond to usage on the plateform after 2015. The current usage metrics is available 48-96 hours after online publication and is updated daily on week days.
Initial download of the metrics may take a while.