Fig. 16
Download original image
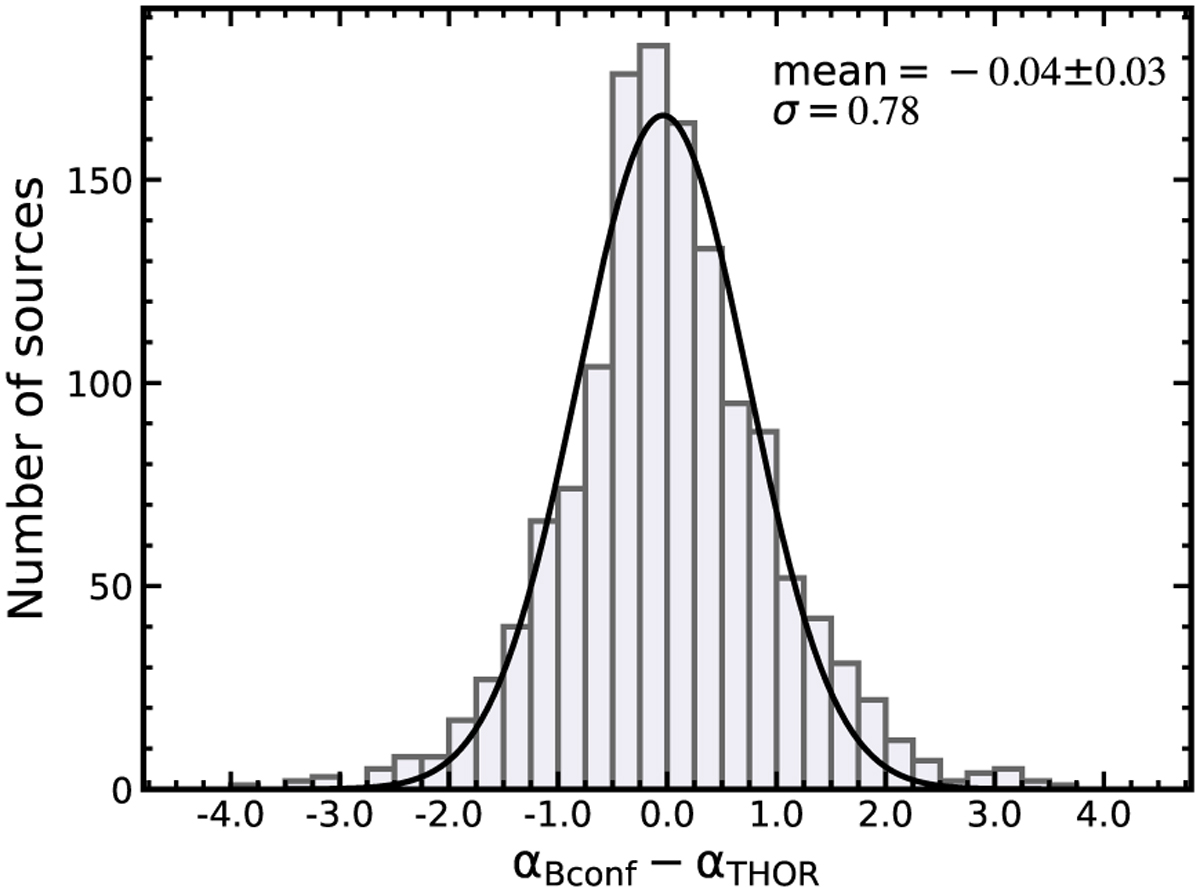
Distribution for the difference (αBconf − αTHOR) in the measured spectral indices for 1390 compact THOR sources common to GLOSTAR in B-configuration. The black solid line means the Gaussian fit for the distribution, giving a mean value of −0.04 ± 0.03 (the error of the mean is from the Gaussian fit) and a standard deviation of 0.78.
Current usage metrics show cumulative count of Article Views (full-text article views including HTML views, PDF and ePub downloads, according to the available data) and Abstracts Views on Vision4Press platform.
Data correspond to usage on the plateform after 2015. The current usage metrics is available 48-96 hours after online publication and is updated daily on week days.
Initial download of the metrics may take a while.