Fig. 15
Download original image
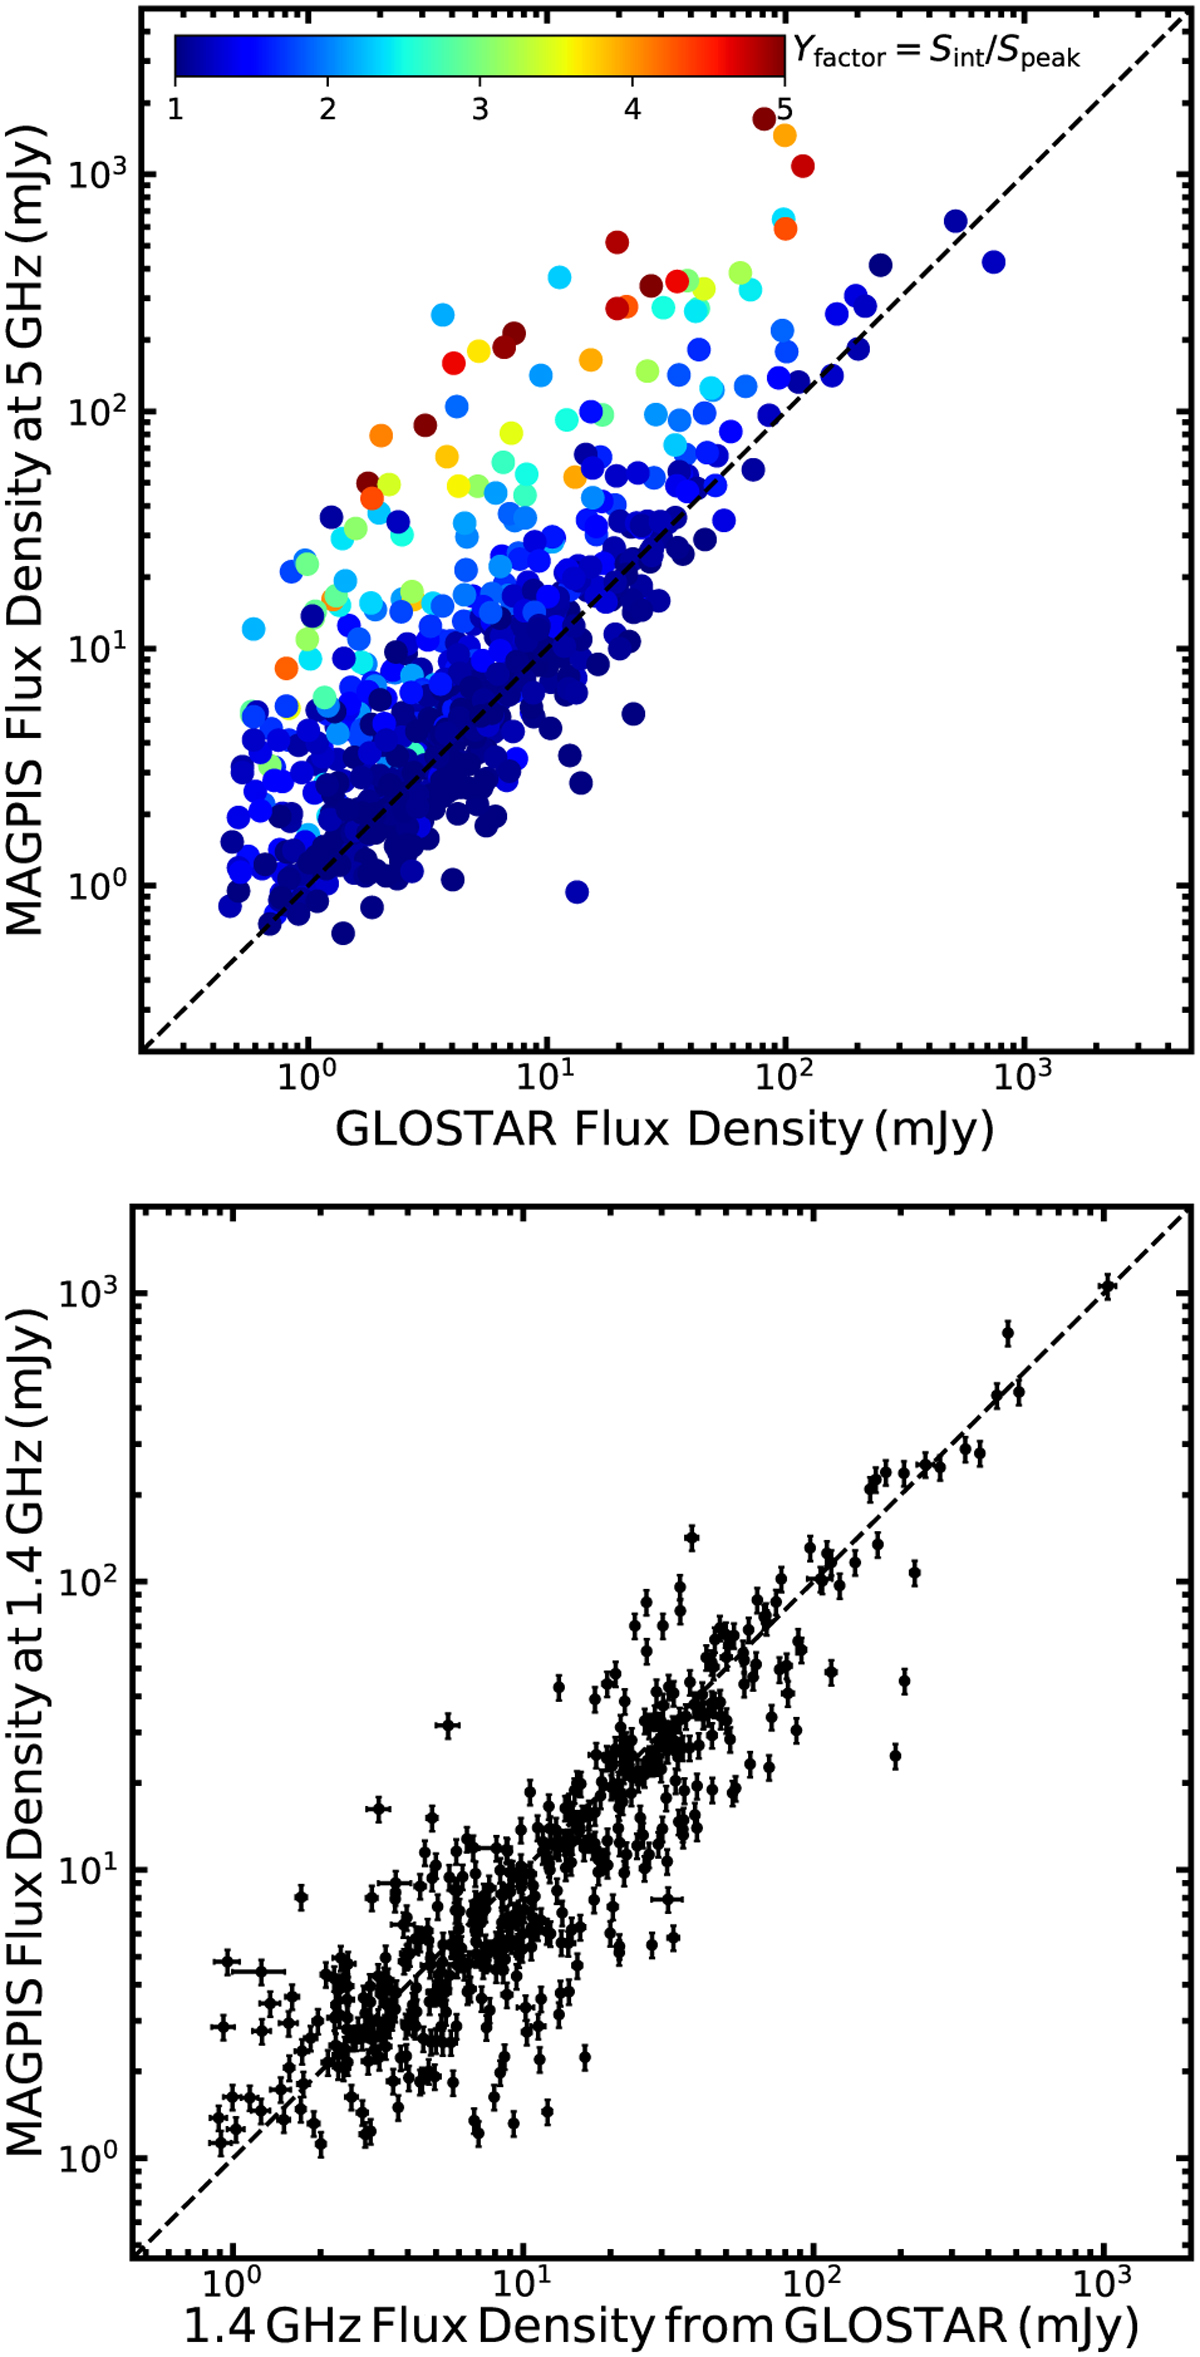
Comparison of flux densities between GLOSTAR and MAGPIS. Top panel: The comparison of measured flux densities for 663 MAGPIS compact sources at 5 GHz (White et al. 2005) common to GLOSTAR. These compact sources are defined as sources with angular sizes < 6″ in MAGPIS. The dashed line means the flux densities are the same in MAGPIS and GLOSTAR. At the top, we show the color bar for the Yfactor (defined as Sint/Speak) of the GLOSTAR detections, indicating the emission of sources in the GLOSTAR image are unresolved (defined as Yfactor < 1.1 in Sect. 4.3.1), compact (1.1 < Yfactor < 2.0) or extended (Yfactor > 2.0). Bottom panel: The comparison of flux densities of 484 compact MAGPIS at 1.4 GHz that are also detected by GLOSTAR at 5 GHz. The 1.4 flux densities from GLOSTAR is extrapolated from the 5 GHz flux densities and spectral indices of the GLOSTAR catalog.
Current usage metrics show cumulative count of Article Views (full-text article views including HTML views, PDF and ePub downloads, according to the available data) and Abstracts Views on Vision4Press platform.
Data correspond to usage on the plateform after 2015. The current usage metrics is available 48-96 hours after online publication and is updated daily on week days.
Initial download of the metrics may take a while.