Fig. 14
Download original image
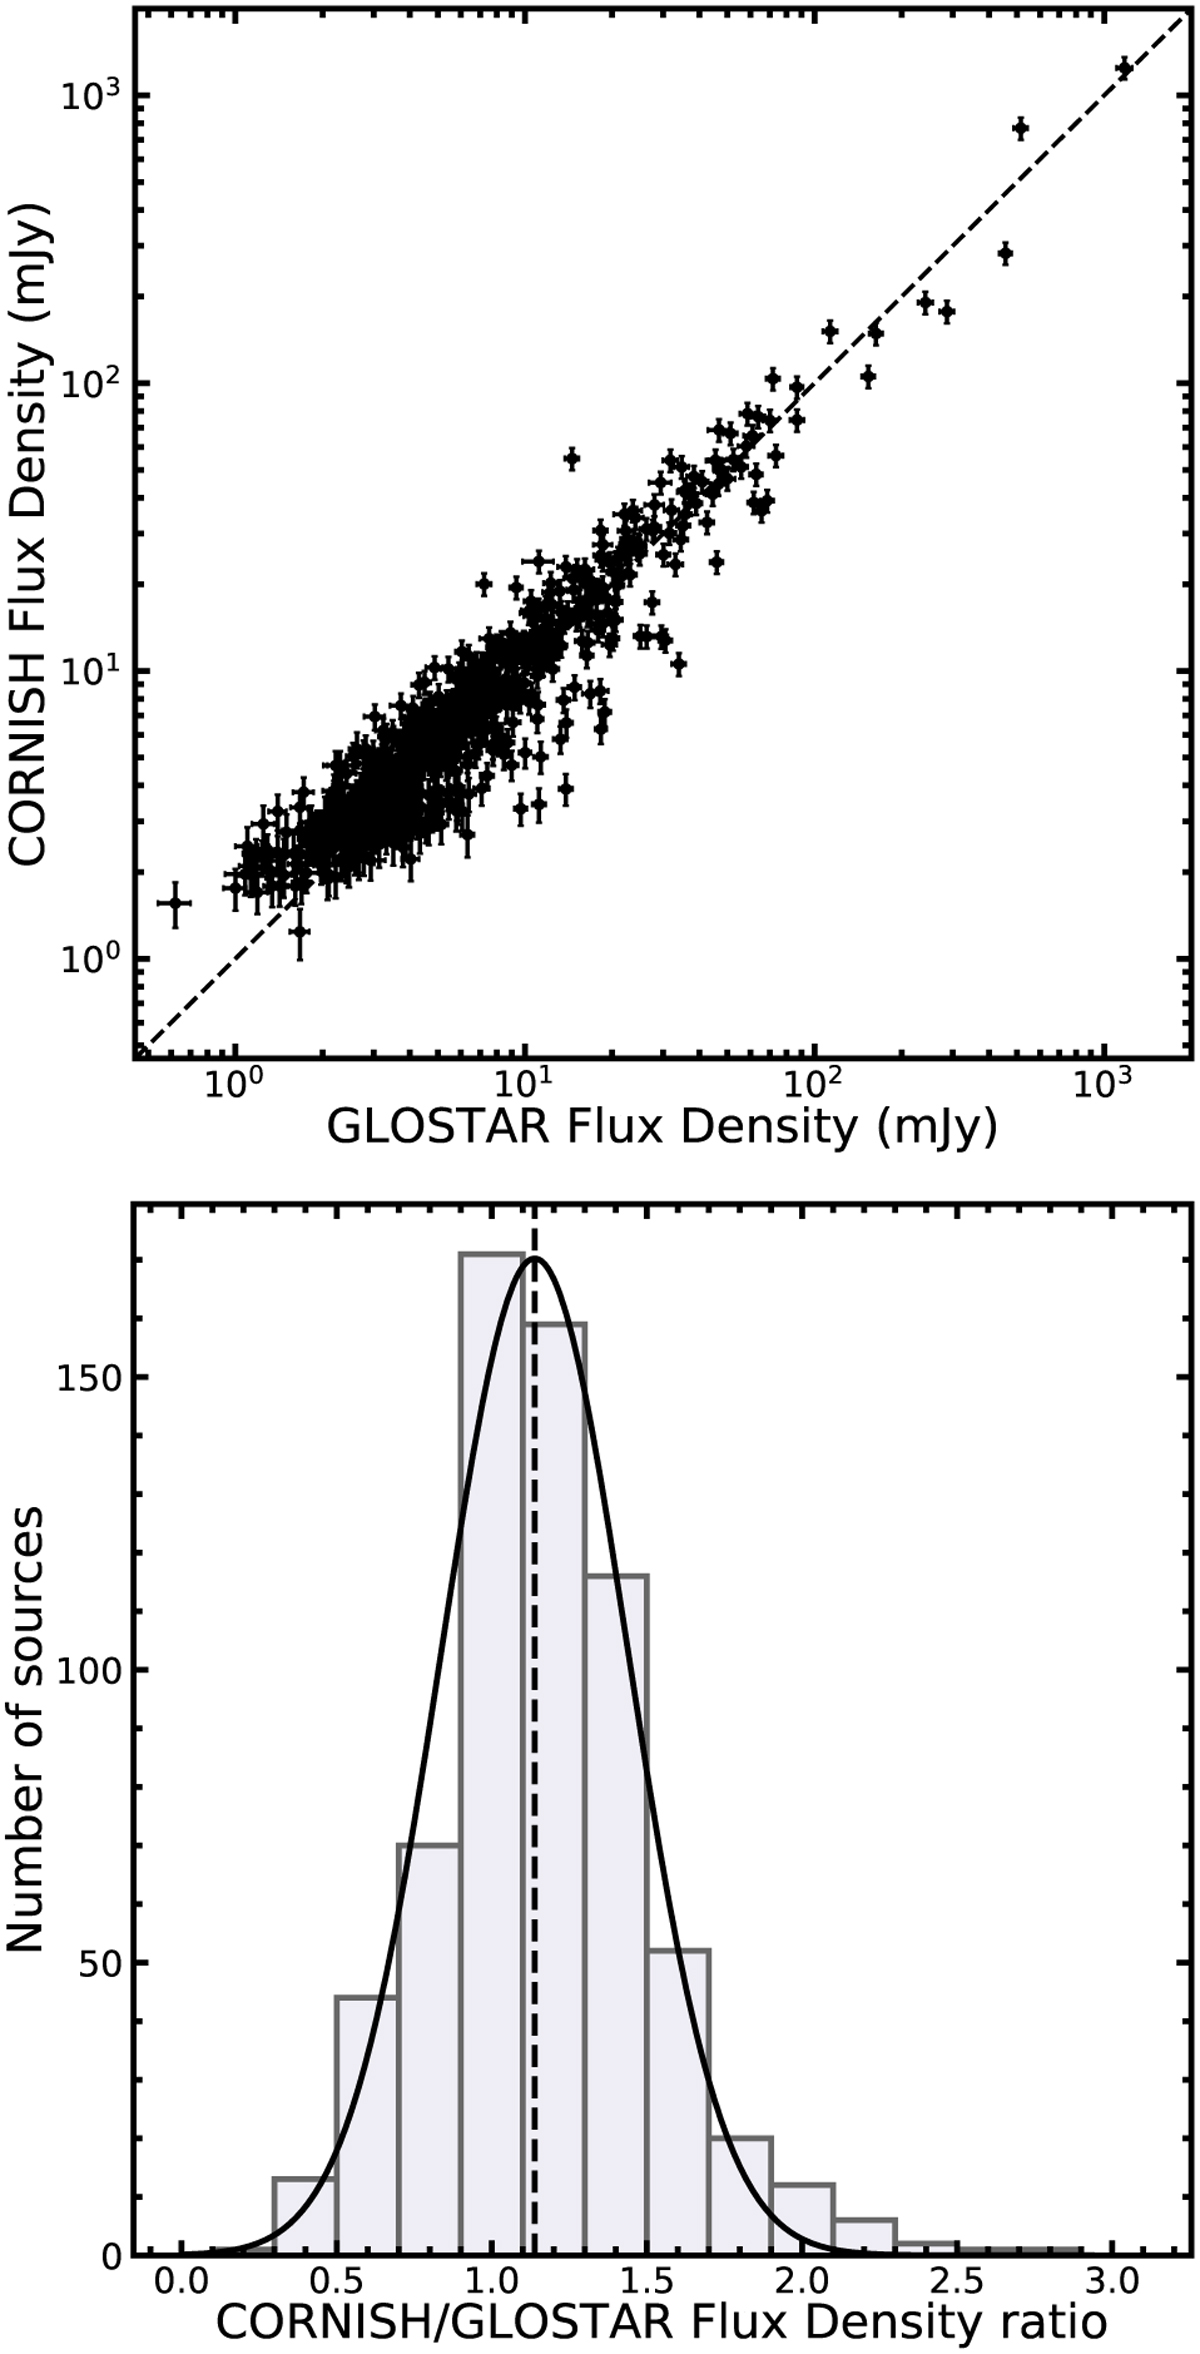
Comparison of flux densities between GLOSTAR and CORNISH. Top panel: the comparison of flux densities for 669 compact sources detected by both CORNISH and GLOSTAR catalogs. The error bar of each point shows the uncertainty of flux. Bottom panel: the histogram of the flux density ratios of compact sources between CORNISH and GLOSTAR. The black line displays the Gaussian fit to the histogram. The dashed line presents the mean value of the distribution, with mean and standard deviation of the flux ratio from the Gaussian fit are 1.14 and 0.3, respectively.
Current usage metrics show cumulative count of Article Views (full-text article views including HTML views, PDF and ePub downloads, according to the available data) and Abstracts Views on Vision4Press platform.
Data correspond to usage on the plateform after 2015. The current usage metrics is available 48-96 hours after online publication and is updated daily on week days.
Initial download of the metrics may take a while.