Fig. 1
Download original image
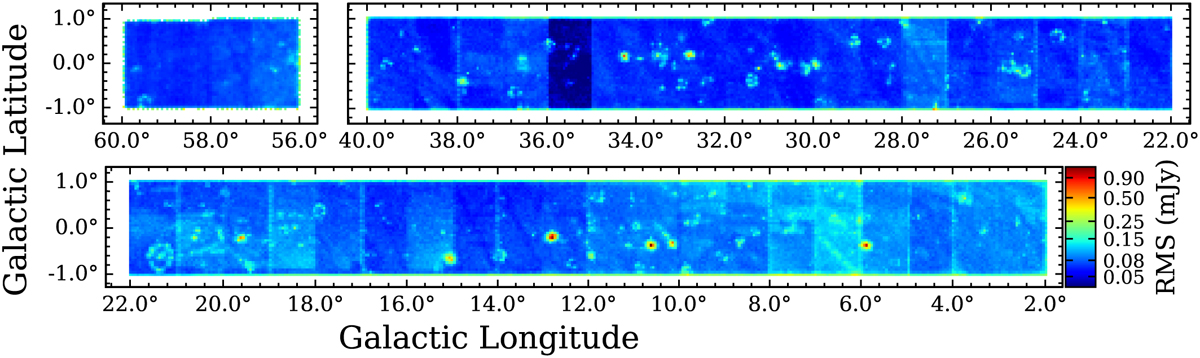
RMS noise map of the 2° < ℓ < 40°, 56° < ℓ < 60°, and |b| < 1° region observed in B-configuration of the GLOSTAR survey. Each field is made by sampling on a size of 3′.25. High noise levels are found in the fields associated with bright emissions (the star-forming regions, H II regions, and other bright radio-emitting sources), observed at low declinations (close to the Galactic center), observed in bad weather conditions, and located at the edge area of the survey. High noise striping in Galactic Latitude is due to changes in observing conditions between scans. For B-configuration data of the “pilot region” of the GLOSTAR survey (28° < ℓ < 36°, |b| < 1°), see Dzib et al. (2023).
Current usage metrics show cumulative count of Article Views (full-text article views including HTML views, PDF and ePub downloads, according to the available data) and Abstracts Views on Vision4Press platform.
Data correspond to usage on the plateform after 2015. The current usage metrics is available 48-96 hours after online publication and is updated daily on week days.
Initial download of the metrics may take a while.