Fig. 6
Download original image
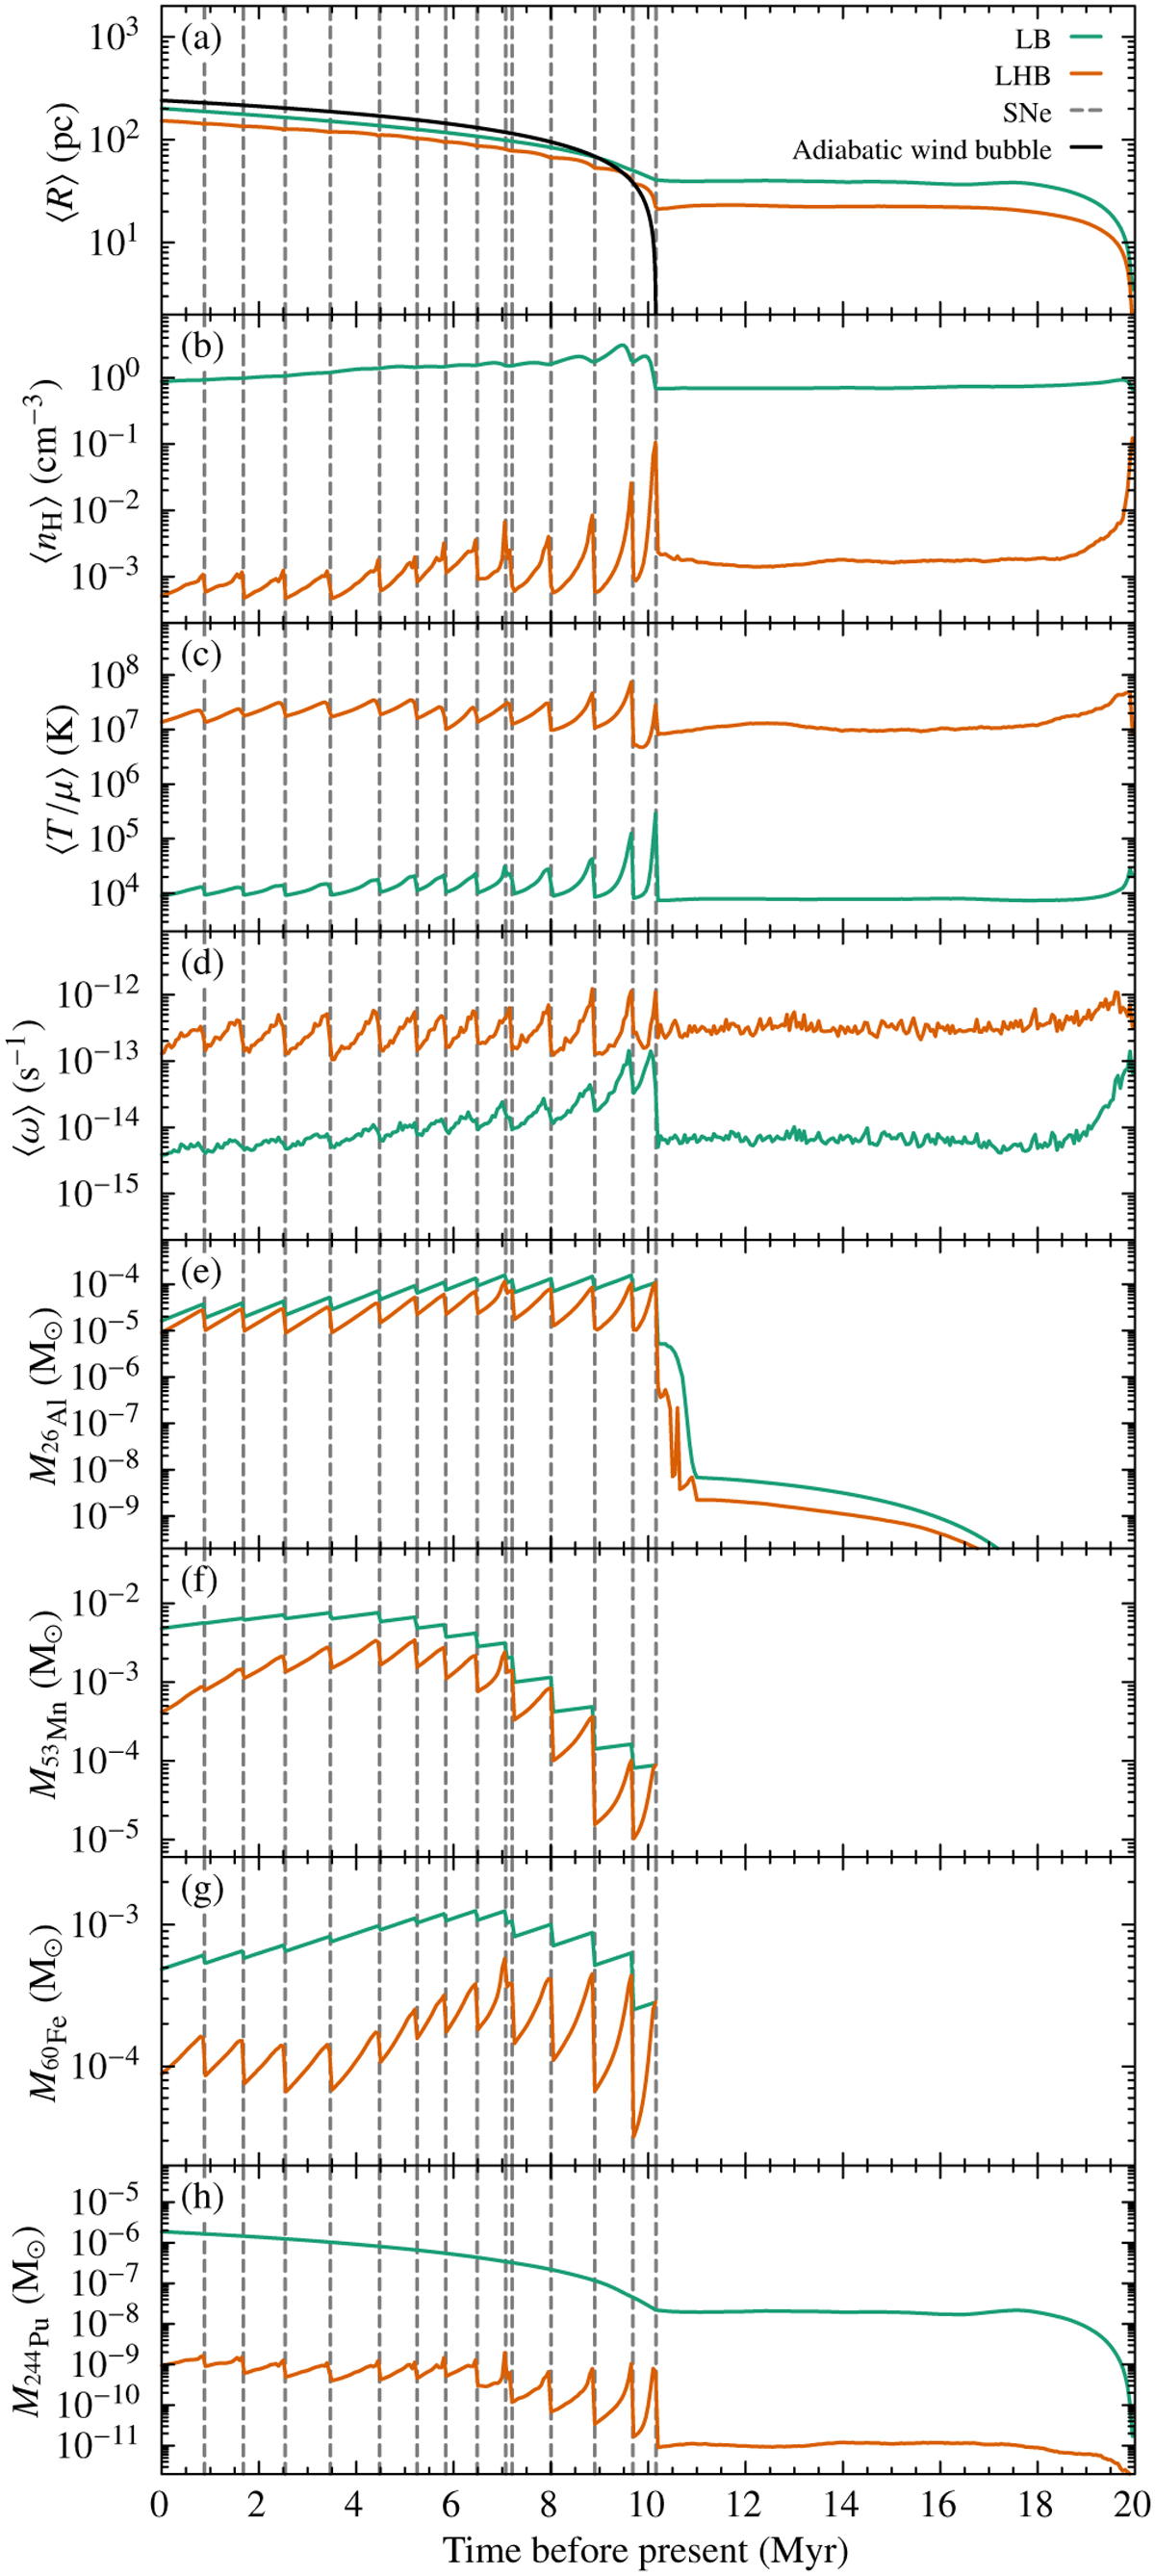
Temporal evolution of (a) the equivalence radius (see text for the definition), (b) the average atomic hydrogen number density, (c) the average temperature (T/µ), (d) the average absolute vorticity, (e) the 26Al mass, (f) the 53Mn mass, (g) the 60Fe mass, and (h) the 244Pu mass of the LB (turquoise curve) and the LHB (orange curve) gas in our fiducial simulation. The averages given for the LB (LHB) gas are weighted by mass (volume). The vertical dashed lines mark the explosion times of the individual SNe. Thus, the part of the profiles to the right of the rightmost dashed line reflects the conditions during the wind-driven phase, whereas almost all the rest of the profiles corresponds to the SN-driven phase. Only the part covering the last few 0.1 Myr before present belongs to the final phase of evolution. In panel a, the self-similar wind solution of Weaver et al. (1977) appropriate for the SN-driven phase is shown for comparison (black curve).
Current usage metrics show cumulative count of Article Views (full-text article views including HTML views, PDF and ePub downloads, according to the available data) and Abstracts Views on Vision4Press platform.
Data correspond to usage on the plateform after 2015. The current usage metrics is available 48-96 hours after online publication and is updated daily on week days.
Initial download of the metrics may take a while.