Fig. 4
Download original image
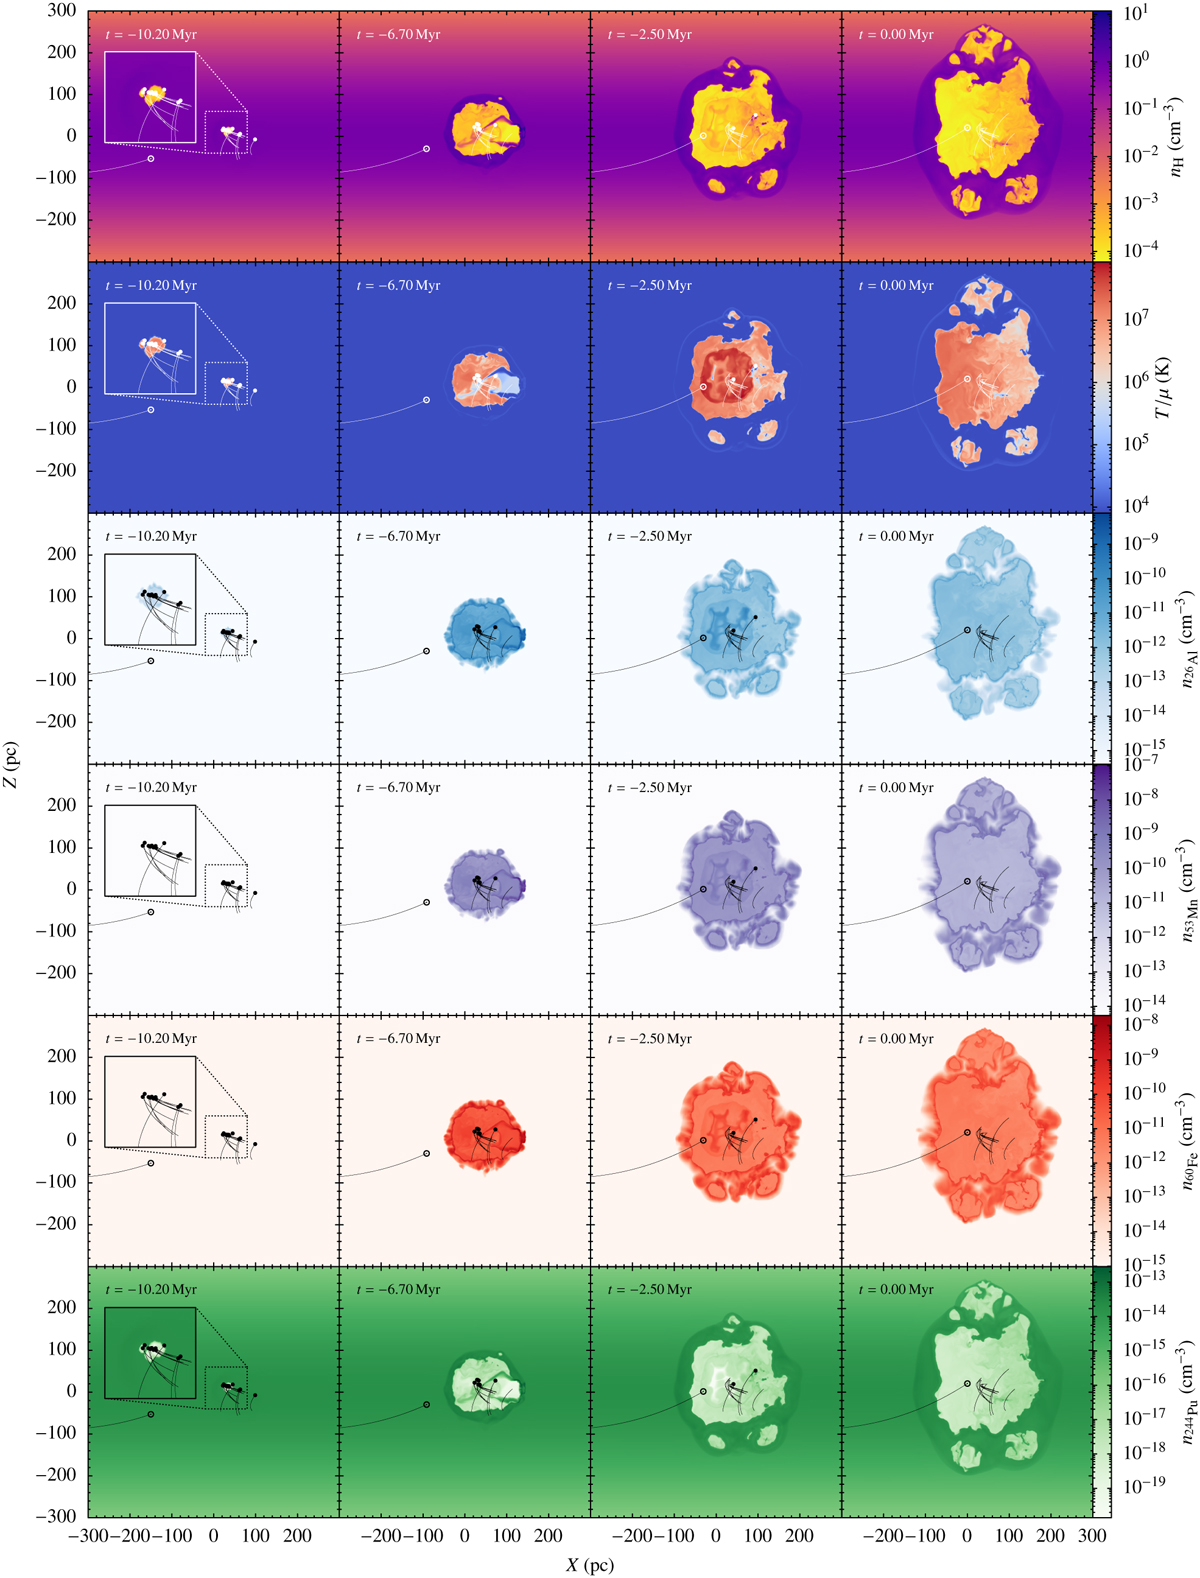
2D axis-aligned slices at Y = 0 through the 3D computational domain showing colour-coded (from top to bottom) the atomic hydrogen number density, temperature, and number densities of the radioisotopes 26Al, 53Mn, 60Fe, and 244Pu in the LB region at different times in the past, as extracted from our fiducial simulation. The overplotted symbols represent for the respective time the projected positions of the Sun (empty circle) and of the SN progenitor stars that have not exploded by then (filled circles). Projected trajectories are shown as thin solid lines. The inlay in the first-column panels shows a magnification of the boxed area with side length 100 pc.
Current usage metrics show cumulative count of Article Views (full-text article views including HTML views, PDF and ePub downloads, according to the available data) and Abstracts Views on Vision4Press platform.
Data correspond to usage on the plateform after 2015. The current usage metrics is available 48-96 hours after online publication and is updated daily on week days.
Initial download of the metrics may take a while.