Fig. 3
Download original image
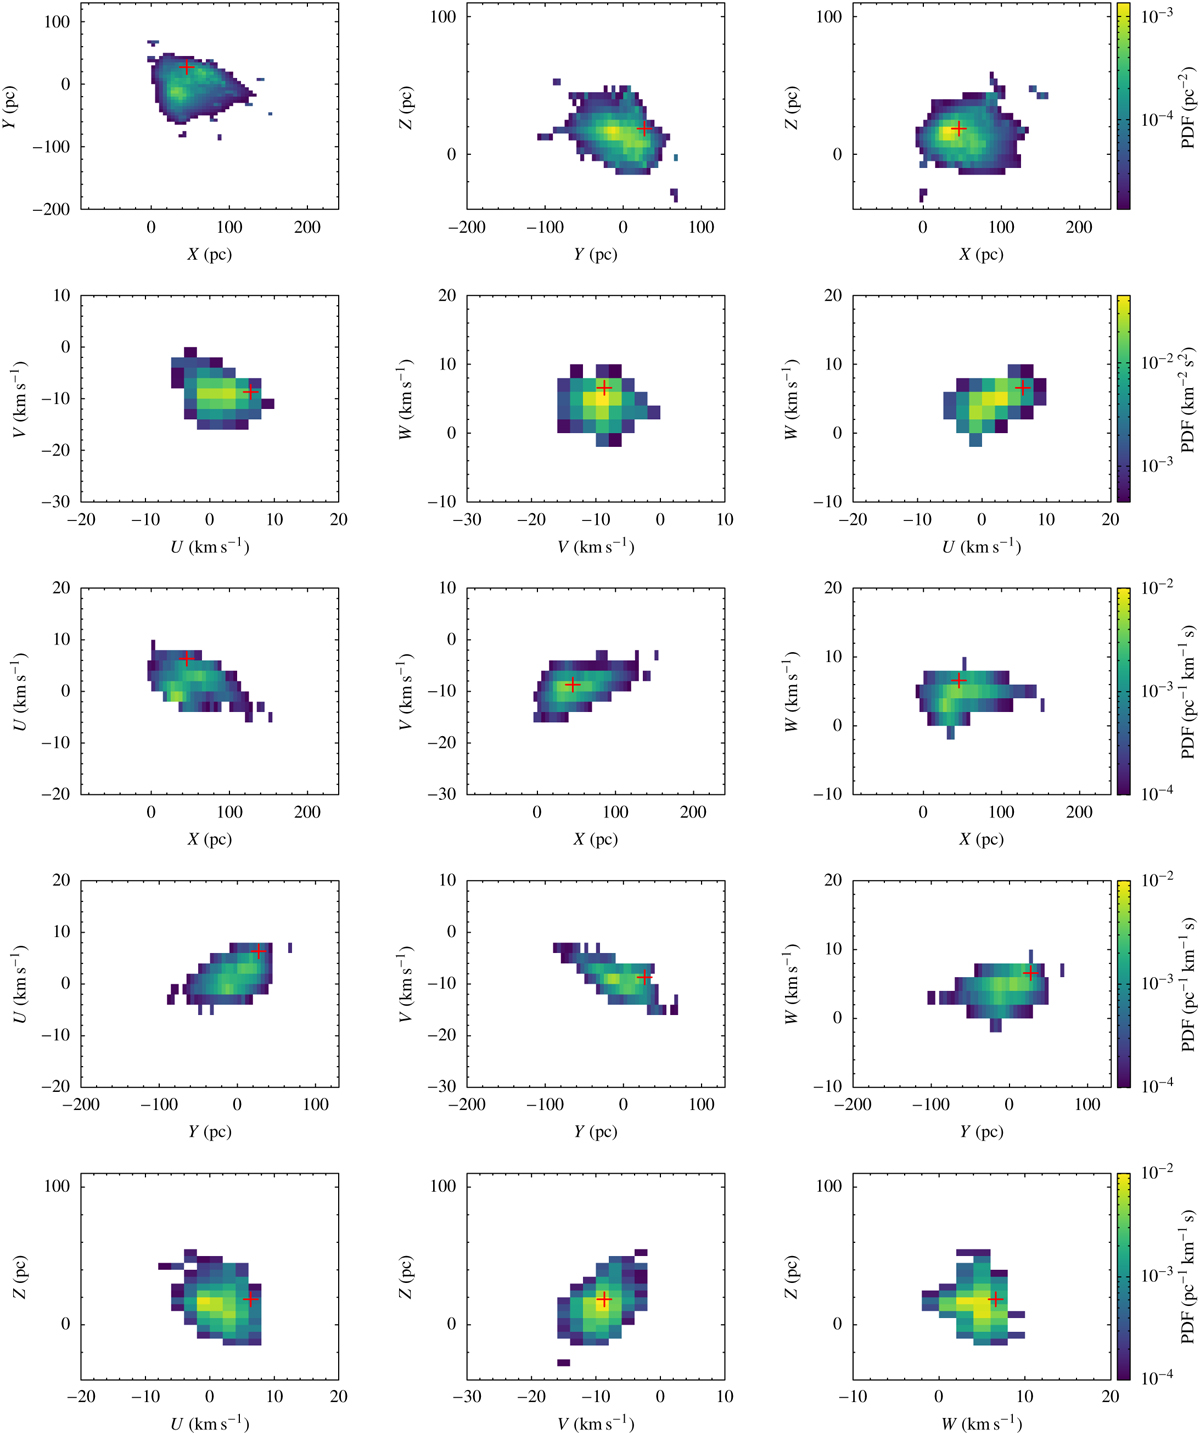
Marginal phase-space PDFs for UCL/LCC at t = −10.16 Myr, computed by tracing back in time 10 000 realisations of the population. The colour bar is the same for all plots in a row. The red crosses mark projections of the bin where the 6D phase-space PDF reaches its maximum value (~ 1.9 × 10⁻⁶pc−3 km−3 s3), which arises from 10 040 of the total 5 420 000 pseudostars (~0.2 per cent). From a purely stellar-statistical point of view, a SN at this particular time should have originated from a massive star at approximately this location with approximately this peculiar velocity.
Current usage metrics show cumulative count of Article Views (full-text article views including HTML views, PDF and ePub downloads, according to the available data) and Abstracts Views on Vision4Press platform.
Data correspond to usage on the plateform after 2015. The current usage metrics is available 48-96 hours after online publication and is updated daily on week days.
Initial download of the metrics may take a while.