Fig. 8.
Download original image
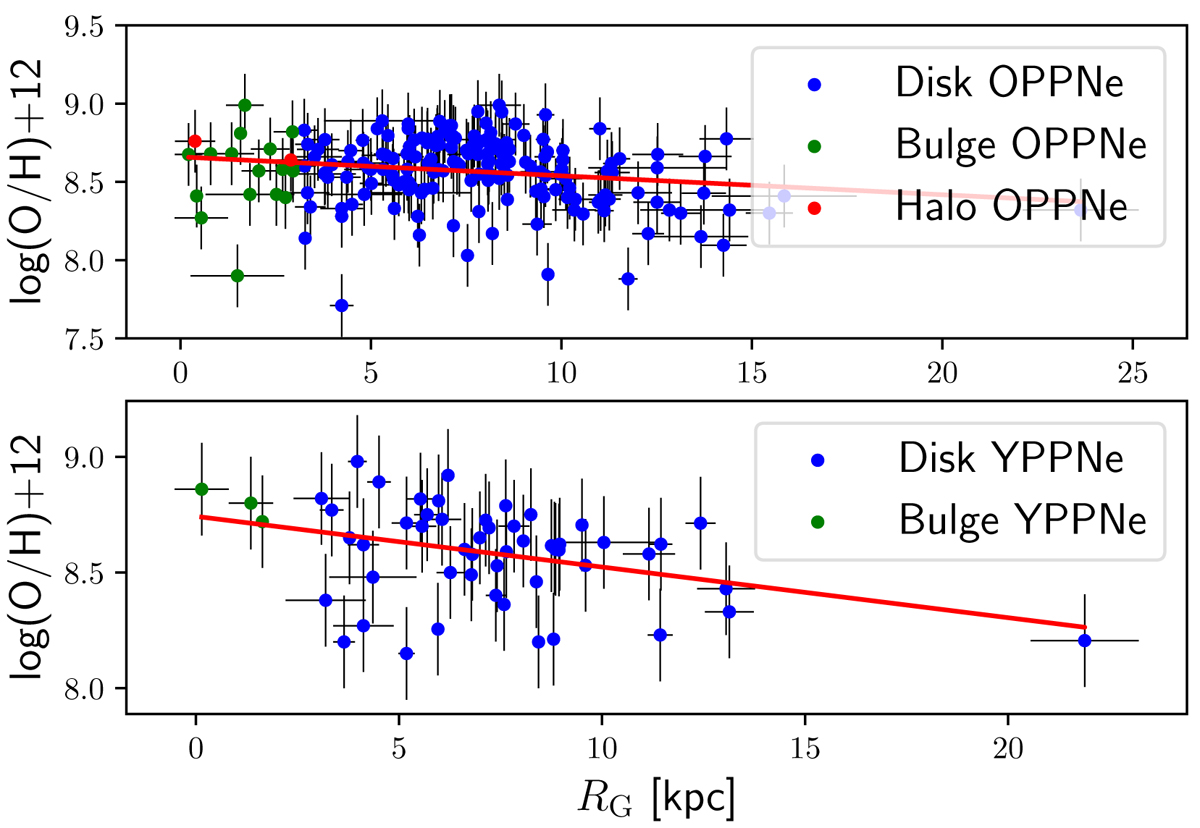
Radial oxygen gradients for the OPPN (top) and the YPPN (bottom) populations. All PNe have been included in these plots, and halo and bulge populations are indicated with different colors. Oxygen abundances are those selected here. The red lines are the linear fits of the data. The slopes and intercepts for the different populations are listed in Table 7.
Current usage metrics show cumulative count of Article Views (full-text article views including HTML views, PDF and ePub downloads, according to the available data) and Abstracts Views on Vision4Press platform.
Data correspond to usage on the plateform after 2015. The current usage metrics is available 48-96 hours after online publication and is updated daily on week days.
Initial download of the metrics may take a while.