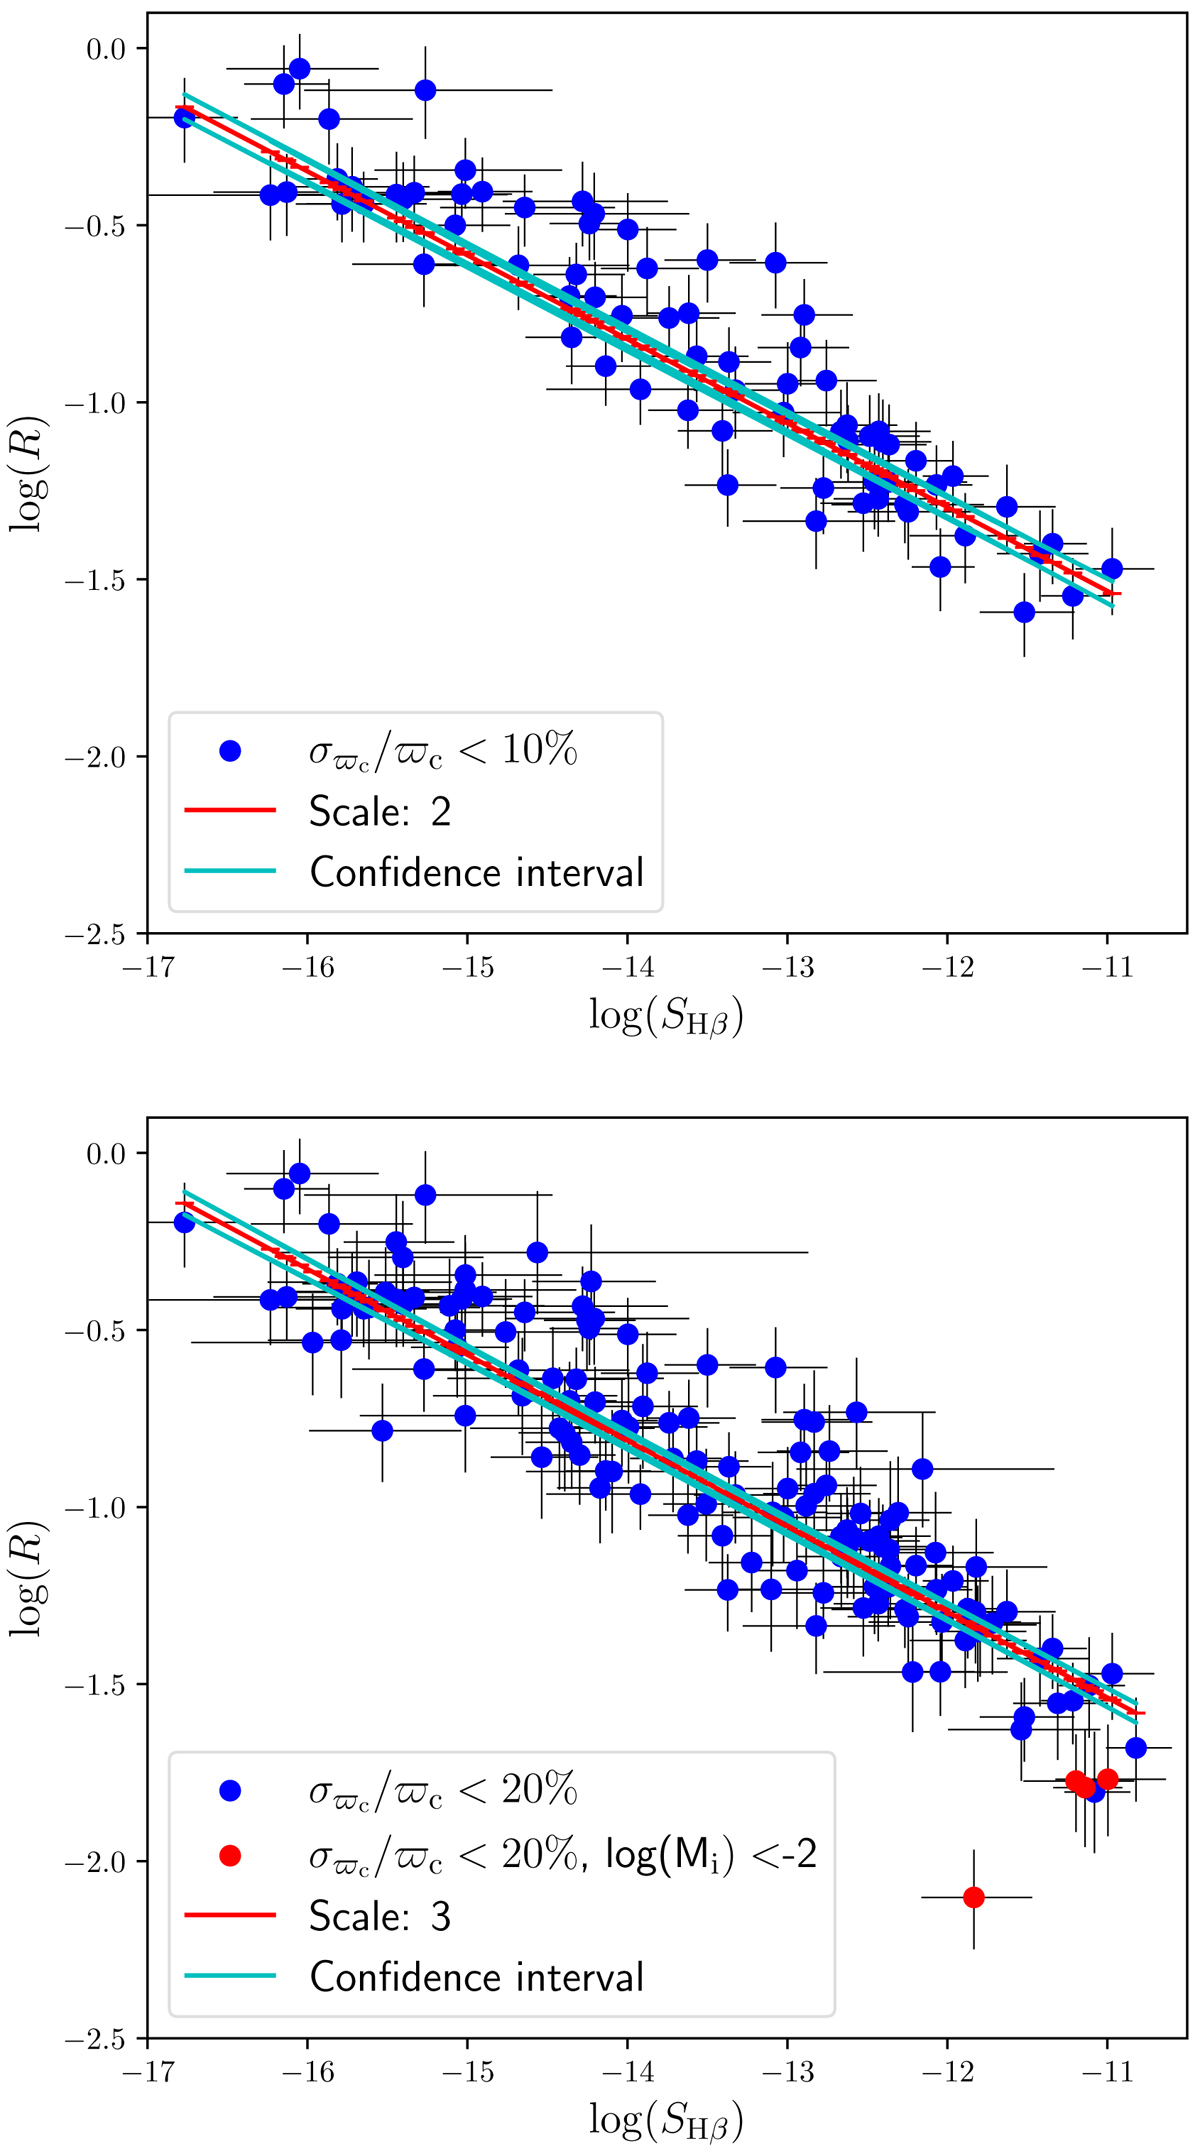
Fig. 2.
Download original image
Log(R) [pc] vs. log(SHβ) [erg cm−2 s−1] plot for calibrators with σϖc/ϖc < 0.1 (top panel) and σϖc/ϖc < 0.2 (bottom panel). In both plots, the blue points are the calibrators. Their logarithmic (asymmetric) error bars reflect the 1σ uncertainties of the observed parameters. In the bottom plot, the red points are the calibrators with log Mi < −2. The red line shows the two distance scales from the calibrators, and in cyan, we plot the 2σ confidence band of the scales, representing the uncertainty of the logarithmic radius R induced by the correlated errors on ![]() and
and ![]() .
.
Current usage metrics show cumulative count of Article Views (full-text article views including HTML views, PDF and ePub downloads, according to the available data) and Abstracts Views on Vision4Press platform.
Data correspond to usage on the plateform after 2015. The current usage metrics is available 48-96 hours after online publication and is updated daily on week days.
Initial download of the metrics may take a while.