Fig. 9.
Download original image
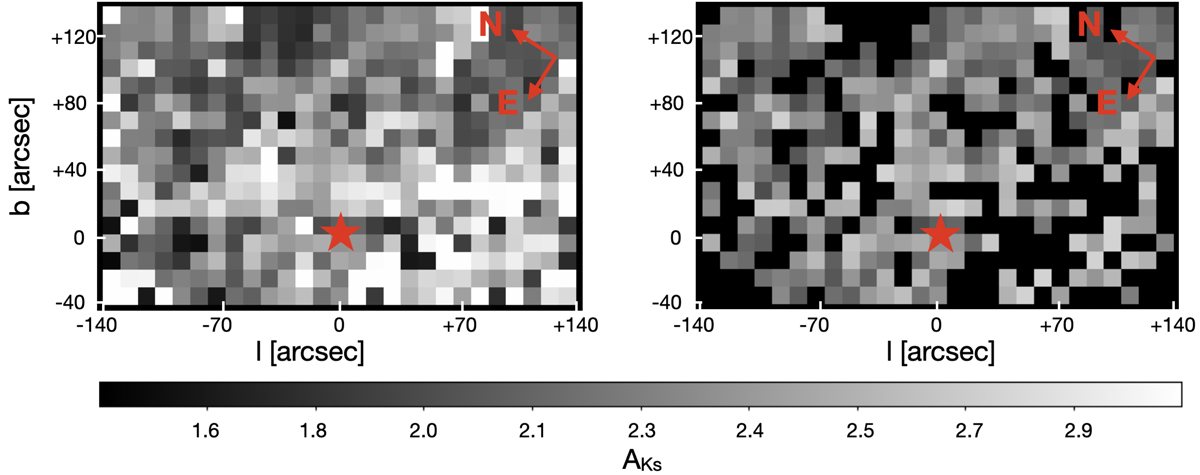
Extinction map for the entire analysed (left panel) and the same map excluding pixels (in black) that deviate by more than one standard deviation from the median extinction (right panel). The x and y axes indicate the distance from Sgr A* (red star) in arc-seconds. The extinction value of each pixel, AKs, is indicated by the scale bar.
Current usage metrics show cumulative count of Article Views (full-text article views including HTML views, PDF and ePub downloads, according to the available data) and Abstracts Views on Vision4Press platform.
Data correspond to usage on the plateform after 2015. The current usage metrics is available 48-96 hours after online publication and is updated daily on week days.
Initial download of the metrics may take a while.