Open Access
Fig. 5.
Download original image
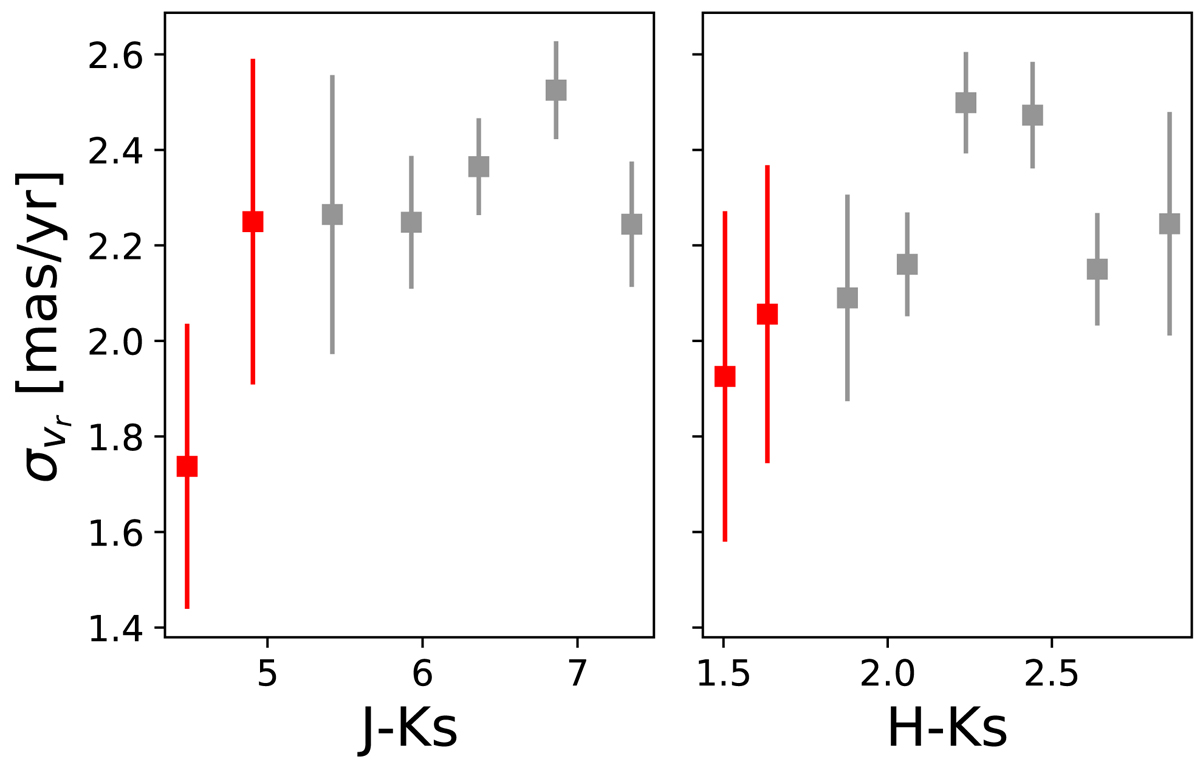
Variation of the dispersion of line-of-sight velocities as a function of colour. The red and grey squares correspond to stars from the MWNSD and MWNSC following the extinction criterion in Sect. 3. The x-coordinates of the data points were calculated assuming the median value of the stars in each colour bin.
Current usage metrics show cumulative count of Article Views (full-text article views including HTML views, PDF and ePub downloads, according to the available data) and Abstracts Views on Vision4Press platform.
Data correspond to usage on the plateform after 2015. The current usage metrics is available 48-96 hours after online publication and is updated daily on week days.
Initial download of the metrics may take a while.