Fig. 2.
Download original image
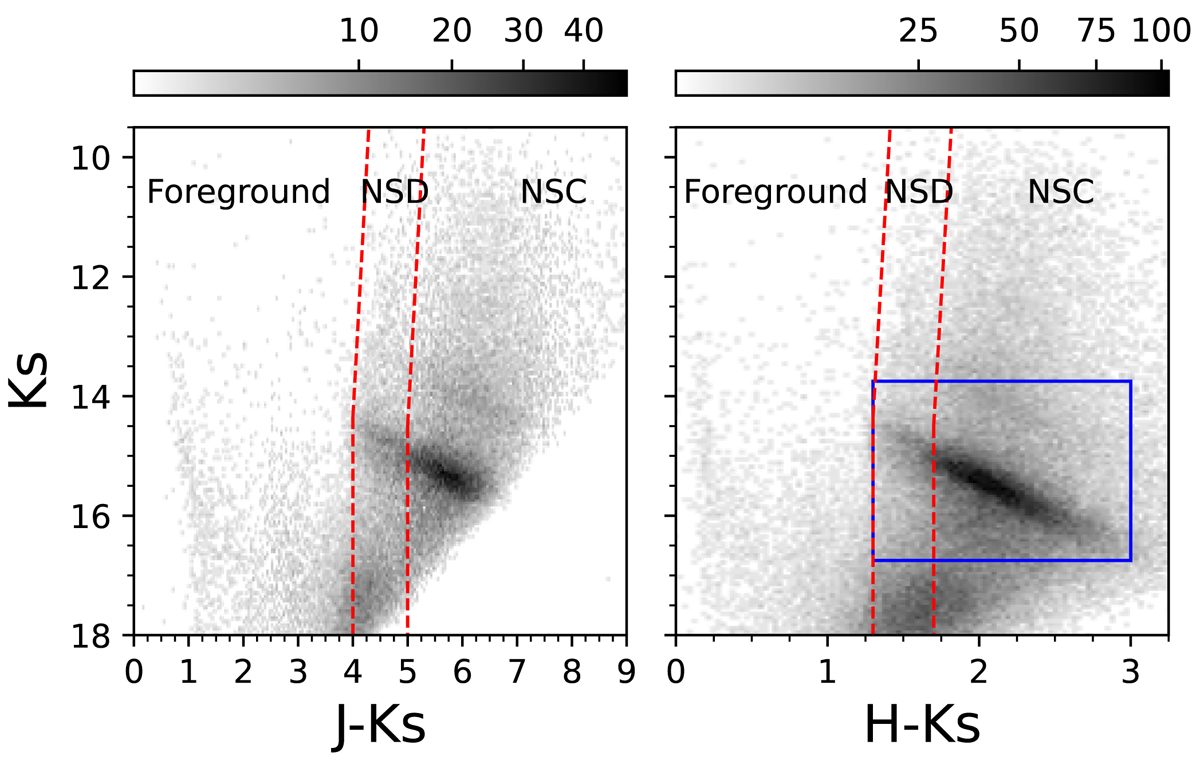
CMDs Ks versus J − Ks (left panel) and Ks versus H − Ks (right panel) for the target region. The red dashed lines indicate the separation between the foreground population, the MWNSD, and the MWNSC. The blue box in the CMD Ks versus H − Ks shows the reference stars to build the extinction map in Sect. 5.1. The scale bars indicate stellar densities using a power stretch scale.
Current usage metrics show cumulative count of Article Views (full-text article views including HTML views, PDF and ePub downloads, according to the available data) and Abstracts Views on Vision4Press platform.
Data correspond to usage on the plateform after 2015. The current usage metrics is available 48-96 hours after online publication and is updated daily on week days.
Initial download of the metrics may take a while.