Fig. 1.
Download original image
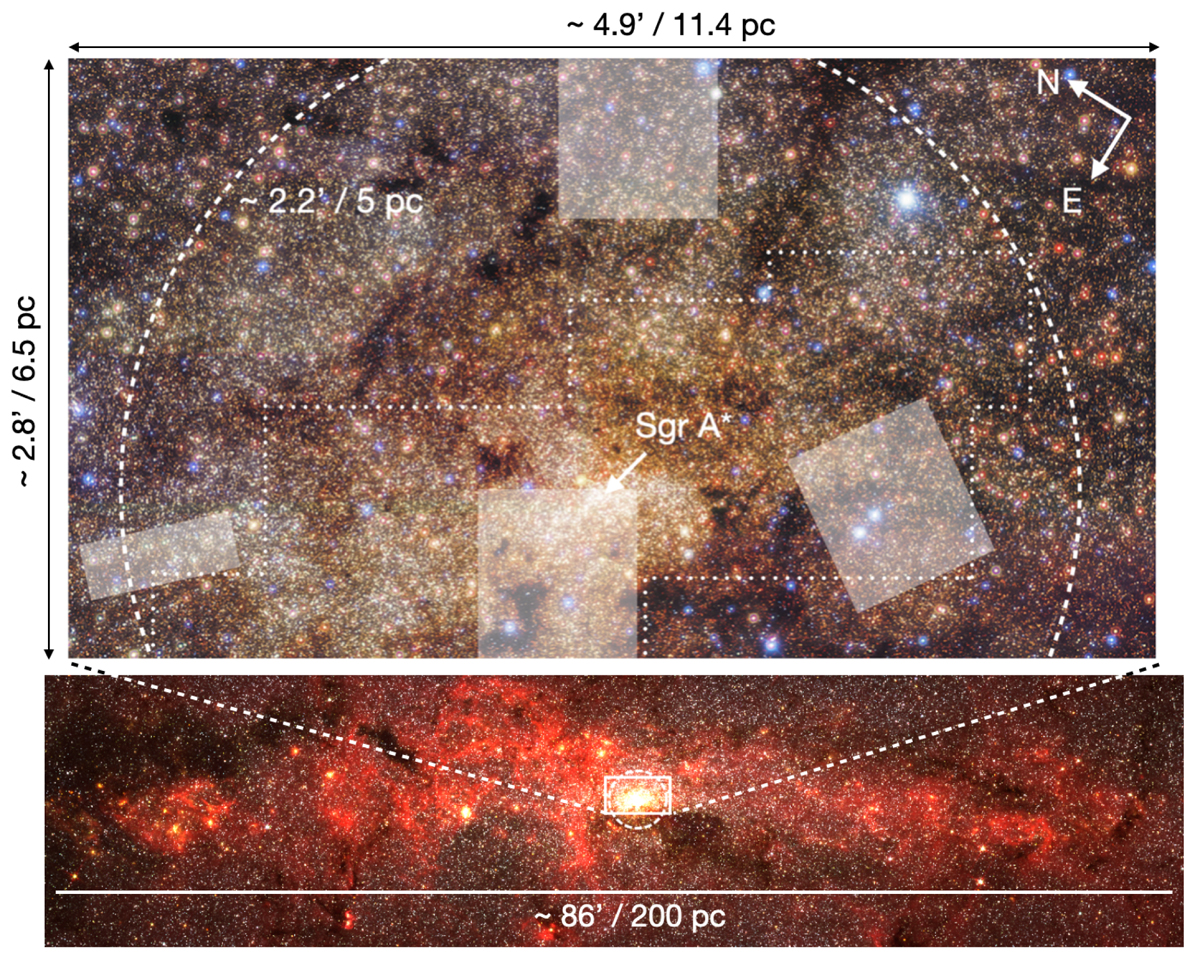
Target region centred on the MWNSC. The lower panel shows a Spitzer false colour image (3.6 μm (blue), 4.5 μm (green), 5.8 μm (red), Stolovy et al. 2006). The upper panel corresponds to a false colour JHKs GALACTICNUCLEUS image adapted from Nogueras-Lara (2022a). The circular dashed region outlines the effective radius of the MWNSC, the white dotted contour shows the region with KMOS data, and the white filled boxes indicate regions without proper motion data. The position of the supermassive black hole Sagittarius A* (Sgr A*) and the approximate size of the fields at the Galactic centre distance are also indicated in the figure.
Current usage metrics show cumulative count of Article Views (full-text article views including HTML views, PDF and ePub downloads, according to the available data) and Abstracts Views on Vision4Press platform.
Data correspond to usage on the plateform after 2015. The current usage metrics is available 48-96 hours after online publication and is updated daily on week days.
Initial download of the metrics may take a while.