Open Access
Fig. 6.
Download original image
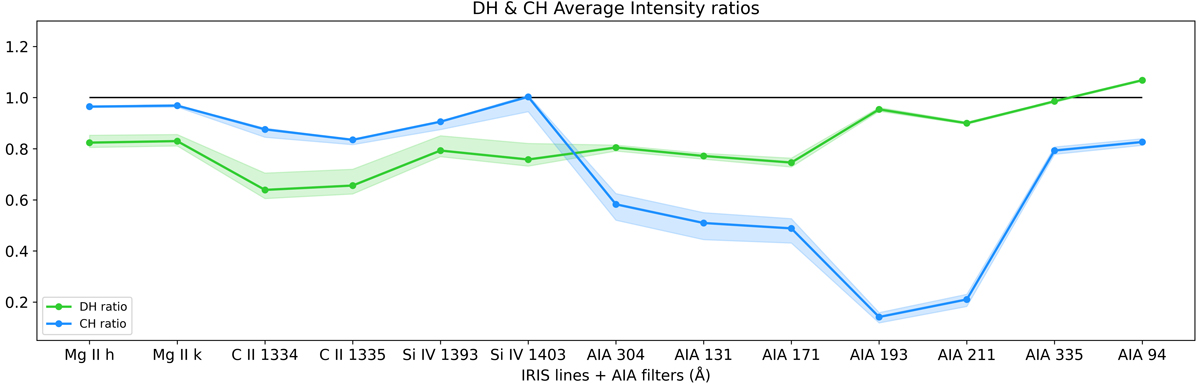
DH (in green) and southern CH (in blue) average intensity ratios in IRIS lines and AIA filters. The shaded areas are the ratio uncertainties, computed as discussed in Sect. 3. The chromospheric fibrillar and the 171 Å coronal DH contours were employed for the IRIS and AIA ratios, respectively.
Current usage metrics show cumulative count of Article Views (full-text article views including HTML views, PDF and ePub downloads, according to the available data) and Abstracts Views on Vision4Press platform.
Data correspond to usage on the plateform after 2015. The current usage metrics is available 48-96 hours after online publication and is updated daily on week days.
Initial download of the metrics may take a while.