Fig. 3.
Download original image
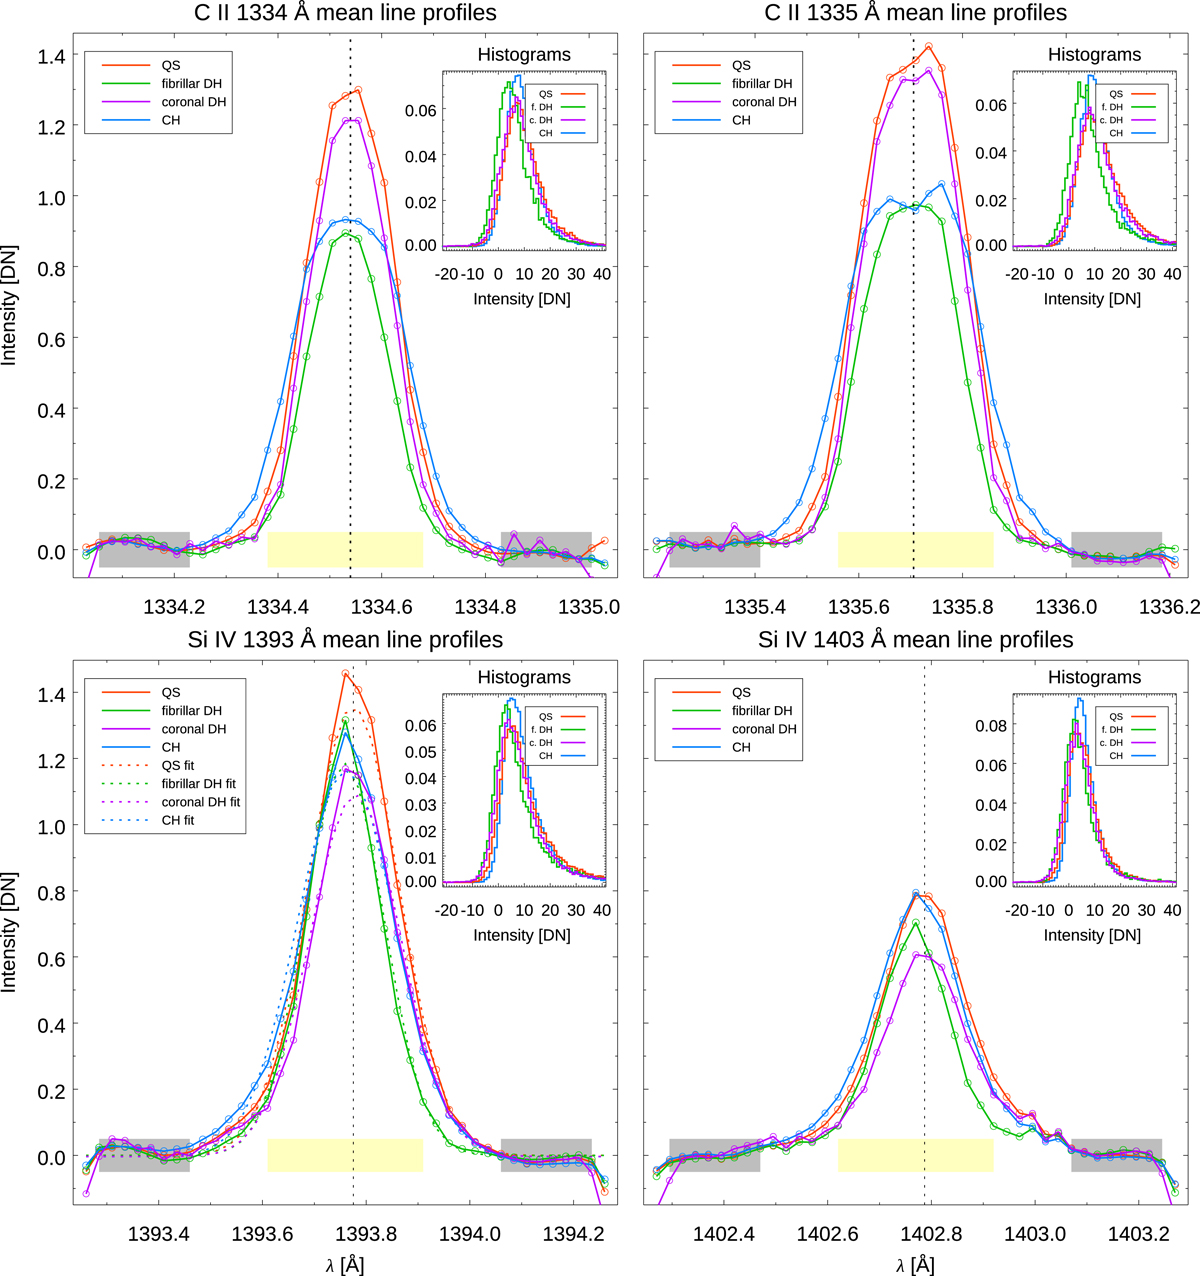
C II 1334 and 1335 Å (upper panels) and Si IV 1393 and 1403 Å (lower panels) average profiles for QS, fibrillar and coronal DH and CH, in red, green, violet, and cyan respectively, with corresponding normalized histograms of the integrated intensities. The vertical dotted lines in the profiles represent the QS reference wavelengths. The yellow and gray bands identify the spectral intervals used for C II and Si IV intensity and background evaluation, respectively. In the lower left panels, the dashed curves are the Si IV 1393 Å fits.
Current usage metrics show cumulative count of Article Views (full-text article views including HTML views, PDF and ePub downloads, according to the available data) and Abstracts Views on Vision4Press platform.
Data correspond to usage on the plateform after 2015. The current usage metrics is available 48-96 hours after online publication and is updated daily on week days.
Initial download of the metrics may take a while.