Open Access
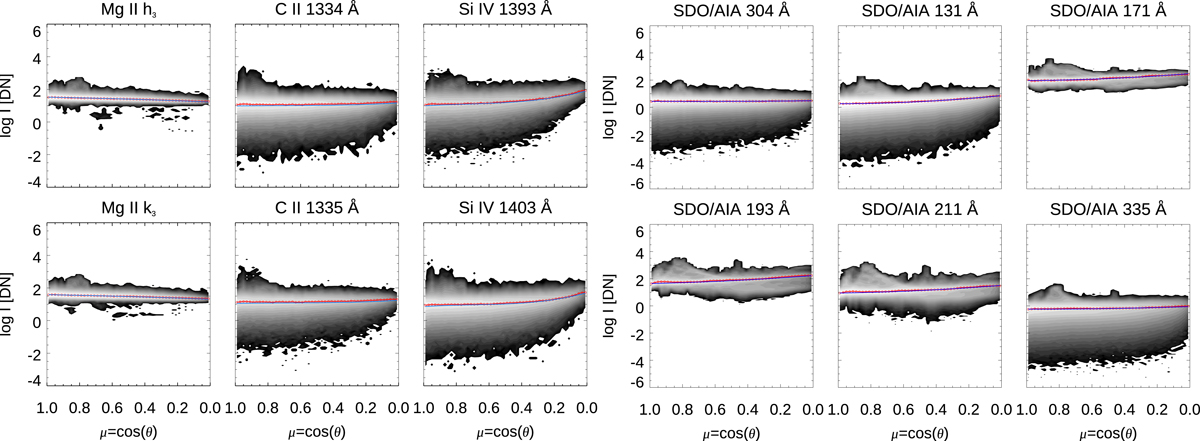
Fig. C.1.
Download original image
Bidimensional histograms vs. μ are shown for all April 22, 2018 IRIS mosaics (left panels) and AIA filtergrams (right panels) used in the analysis. Each red point is the mode of the histogram in the interval Δμ = 0.02. The blue curve is the fit obtained from the seven QS dates, as described in the appendix.
Current usage metrics show cumulative count of Article Views (full-text article views including HTML views, PDF and ePub downloads, according to the available data) and Abstracts Views on Vision4Press platform.
Data correspond to usage on the plateform after 2015. The current usage metrics is available 48-96 hours after online publication and is updated daily on week days.
Initial download of the metrics may take a while.