Fig. 1.
Download original image
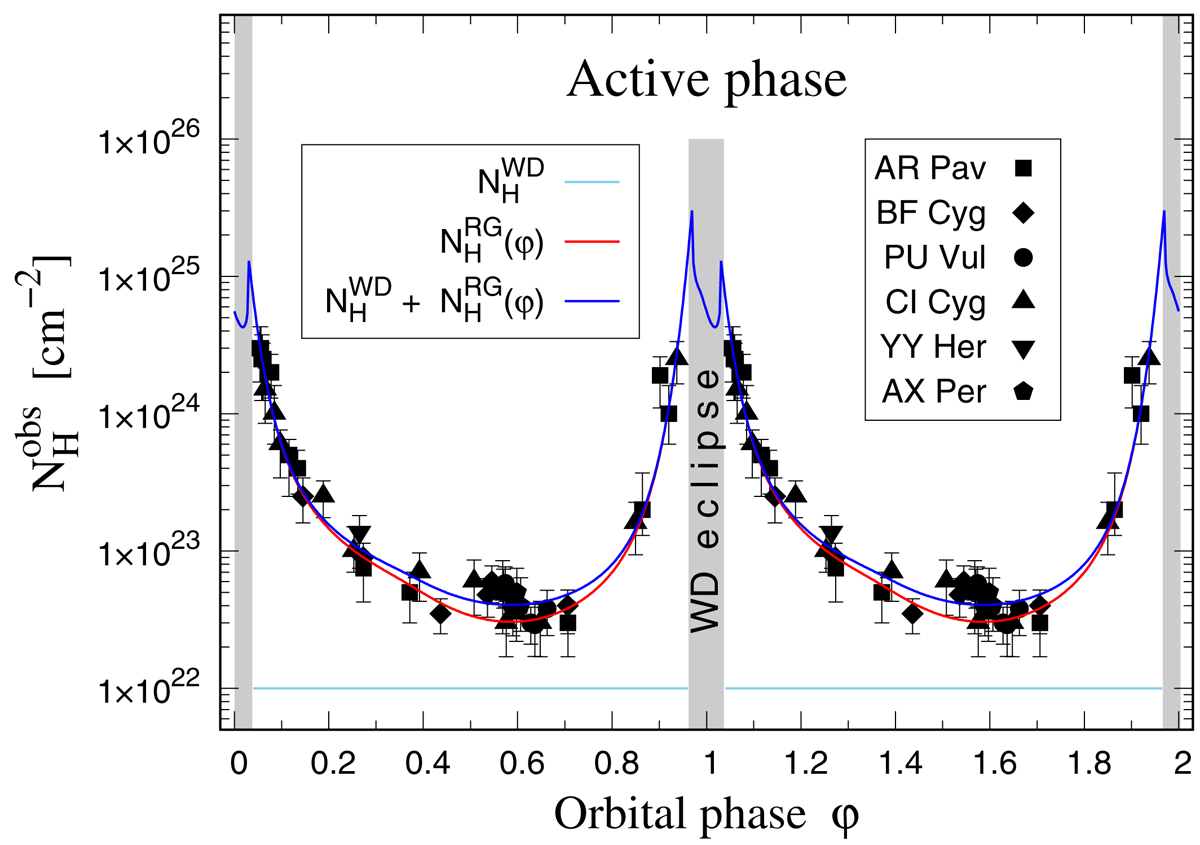
Column densities of atomic hydrogen between the observer and the WD (![]() ) measured for eclipsing SySts during active phases around the whole orbit (data from Skopal 2023). The blue line is the best-fitting model for i = 80° (Table 1). It consists of a constant value along the orbit,
) measured for eclipsing SySts during active phases around the whole orbit (data from Skopal 2023). The blue line is the best-fitting model for i = 80° (Table 1). It consists of a constant value along the orbit, ![]() cm−2, supplied by the compressed neutral wind from the WD during outbursts, and the phase-dependent value,
cm−2, supplied by the compressed neutral wind from the WD during outbursts, and the phase-dependent value, ![]() , of the neutral wind from the RG (see Sect. 2.1). The minimum in the model during the WD eclipse is caused by the fact that the line of sight ends at the surface of the RG, and not on the warm WD’s pseudo-photosphere. Asymmetrical distribution and high values of
, of the neutral wind from the RG (see Sect. 2.1). The minimum in the model during the WD eclipse is caused by the fact that the line of sight ends at the surface of the RG, and not on the warm WD’s pseudo-photosphere. Asymmetrical distribution and high values of ![]() reflect the asymmetric wind from the RG and its focusing on the orbital plane (see the main text).
reflect the asymmetric wind from the RG and its focusing on the orbital plane (see the main text).
Current usage metrics show cumulative count of Article Views (full-text article views including HTML views, PDF and ePub downloads, according to the available data) and Abstracts Views on Vision4Press platform.
Data correspond to usage on the plateform after 2015. The current usage metrics is available 48-96 hours after online publication and is updated daily on week days.
Initial download of the metrics may take a while.