Fig. 9
Download original image
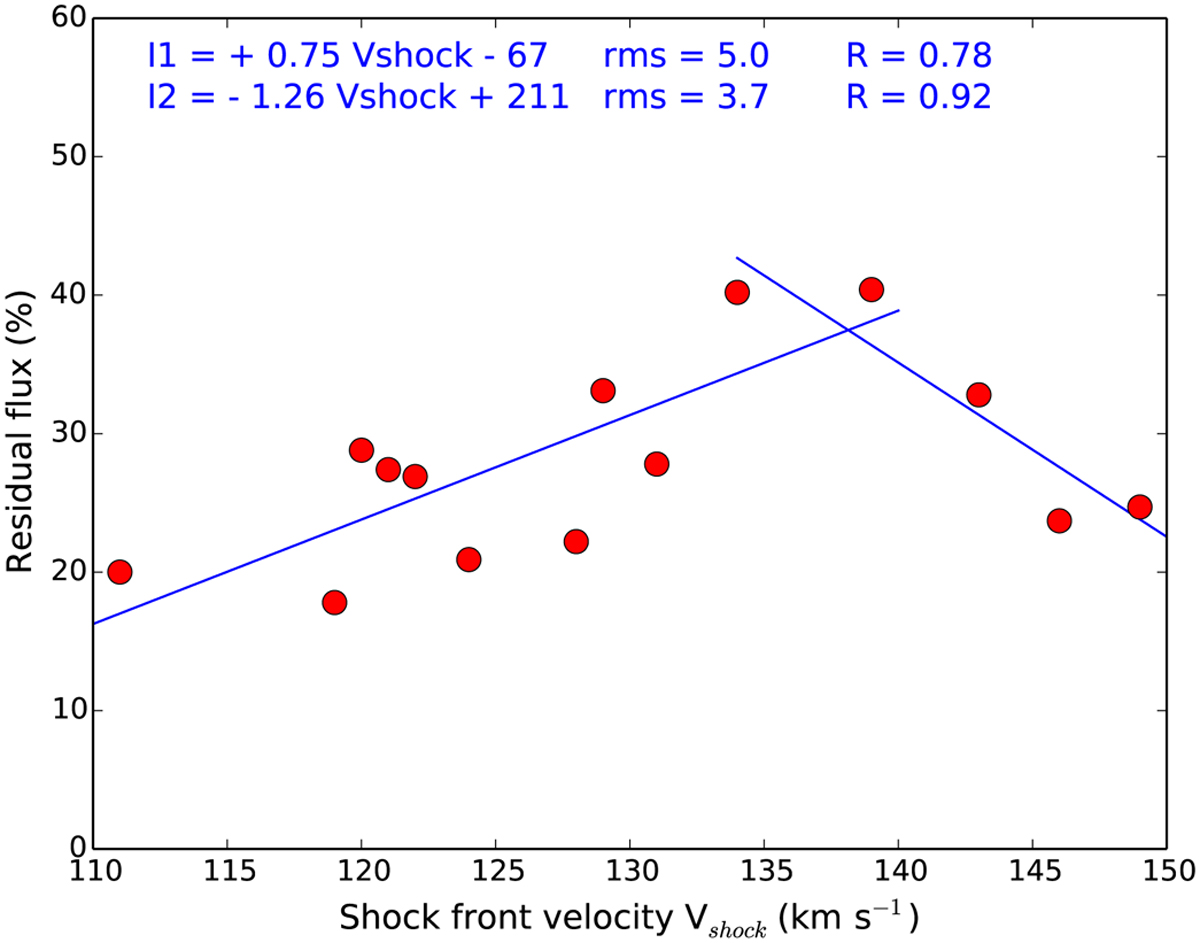
Maximum intensity of the first and main emission of the Hα versus the corresponding shock velocity (red dots: 1990s, blue dots: 2015; see Table 1). Mean uncertainty of residual flux is 2%. The straight linear regression lines through the points between 110 ⩽ Vshock ⩽ 135 and 135 ⩽ Vshock ⩽ 150 are shown. The uncertainty on the shock velocity induced by using Eq. (2) is certainly not smaller than 10 km s−1 when the shock velocity varies respectively from 100 to 150 km s−1.
Current usage metrics show cumulative count of Article Views (full-text article views including HTML views, PDF and ePub downloads, according to the available data) and Abstracts Views on Vision4Press platform.
Data correspond to usage on the plateform after 2015. The current usage metrics is available 48-96 hours after online publication and is updated daily on week days.
Initial download of the metrics may take a while.