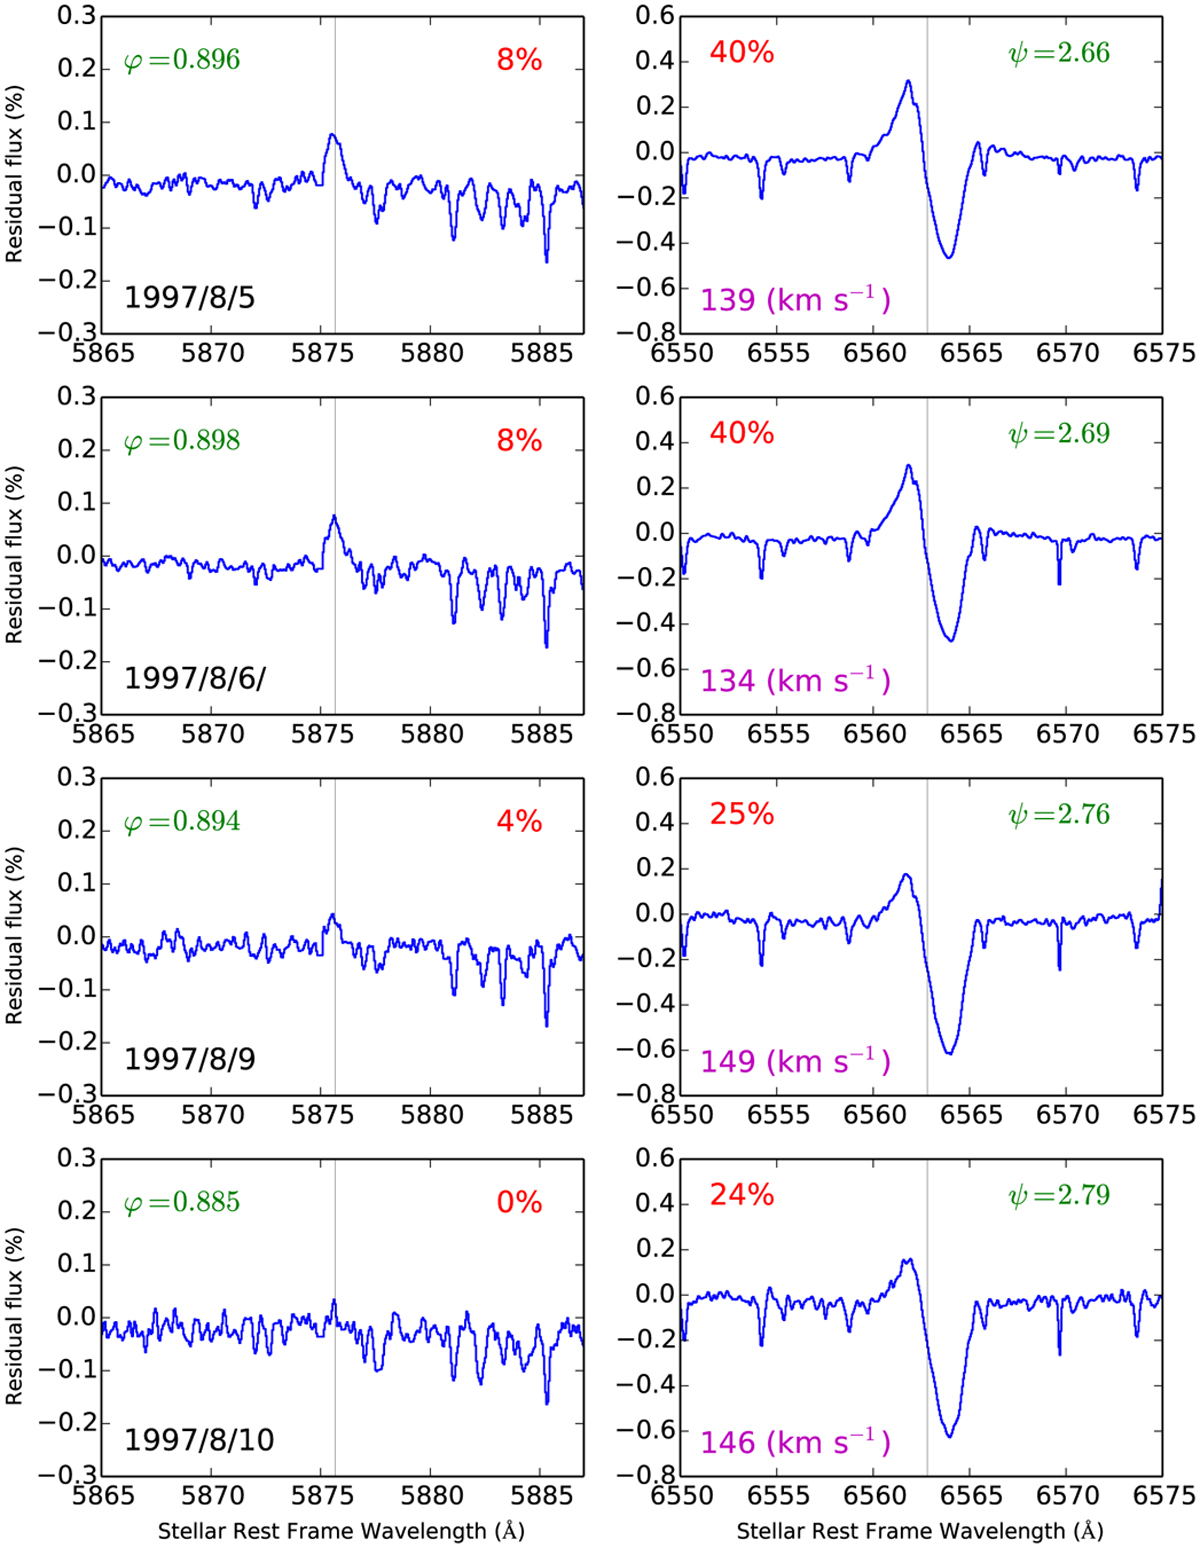
Fig. 8
Download original image
Line profiles of the maximum emission of D3 and Hα at Blazhko phase corresponding to nights August 5, 6, 9, and 10, 1997. For each pair of observation (D3 and Hα), the Blazhko phase ψ, the pulsation phase φ and the intensity of each emission is given with respect to the continuum. The shock velocity is shown in the lower left corner of the right column. The laboratory wavelength is marked by a vertical line. The very narrow “emission” occurring at the wavelength of D3 on August 10, 1997 is probably caused by noise.
Current usage metrics show cumulative count of Article Views (full-text article views including HTML views, PDF and ePub downloads, according to the available data) and Abstracts Views on Vision4Press platform.
Data correspond to usage on the plateform after 2015. The current usage metrics is available 48-96 hours after online publication and is updated daily on week days.
Initial download of the metrics may take a while.