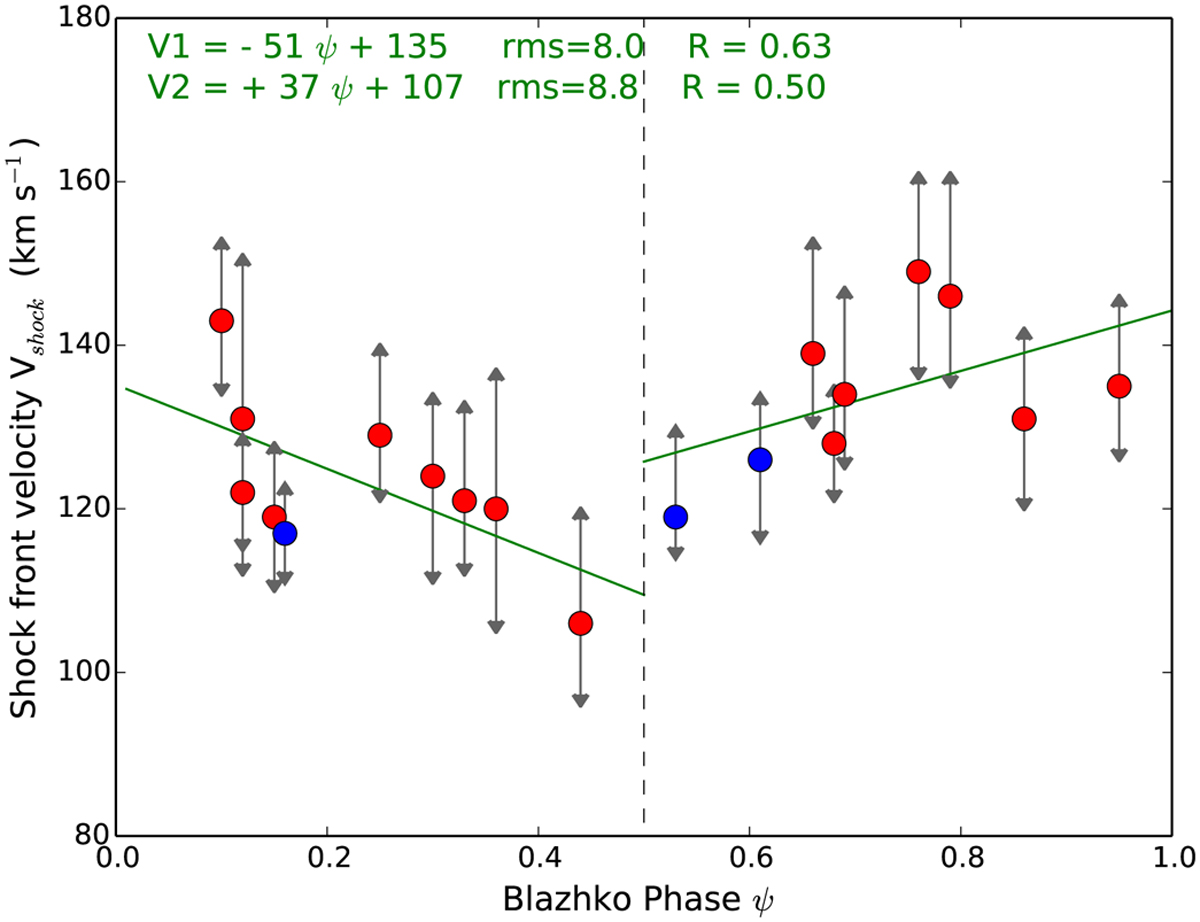
Fig. 6
Download original image
Shock wave velocity estimated from Eq. (2) at different Blazhko phases. The red dots refer to the 90 s and the blue dots refer to the years 2013 and 2015. The uncertainty on the shock velocity induced by using Eq. (2) is certainly not smaller than 10 km s−1 when the shock velocity varies respectively from 100 to 150 km s−1. The uncertainty on the Blazhko phase is estimated at 0.1. The asymmetric vertical bar through each point represents the range of plausible values of Vs used to find the best fit. The straight linear regression lines through the points between 0.0 ⩽ ψ ⩽ 0.5 and 0.5 ⩽ ψ ⩽ 1.0 are shown. Their correlation coefficients R are 0.63 and 0.50, respectively.
Current usage metrics show cumulative count of Article Views (full-text article views including HTML views, PDF and ePub downloads, according to the available data) and Abstracts Views on Vision4Press platform.
Data correspond to usage on the plateform after 2015. The current usage metrics is available 48-96 hours after online publication and is updated daily on week days.
Initial download of the metrics may take a while.