Fig. 5
Download original image
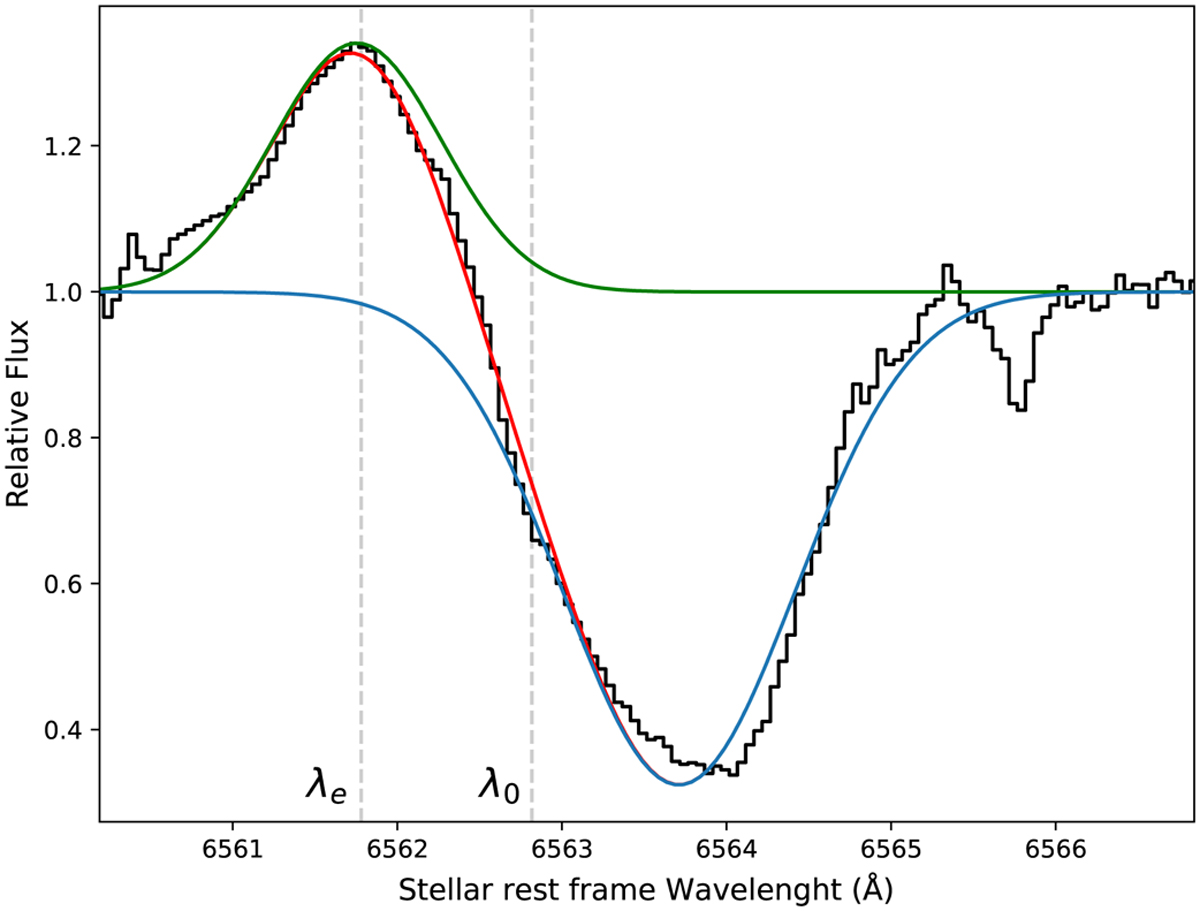
Example of the most plausible fitting for 1996-08-01 spectrum (in black). The synthetic spectra of emission and absorption components are respectively plotted in green and blue color whereas the sum is plotted in red. Note: the distorted red wing of the emission component. The wavelength of the emission component, λe, is measured on the synthetic spectrum of the emission component (green color), thus managing the blueshifting described in the text.
Current usage metrics show cumulative count of Article Views (full-text article views including HTML views, PDF and ePub downloads, according to the available data) and Abstracts Views on Vision4Press platform.
Data correspond to usage on the plateform after 2015. The current usage metrics is available 48-96 hours after online publication and is updated daily on week days.
Initial download of the metrics may take a while.