Fig. 10
Download original image
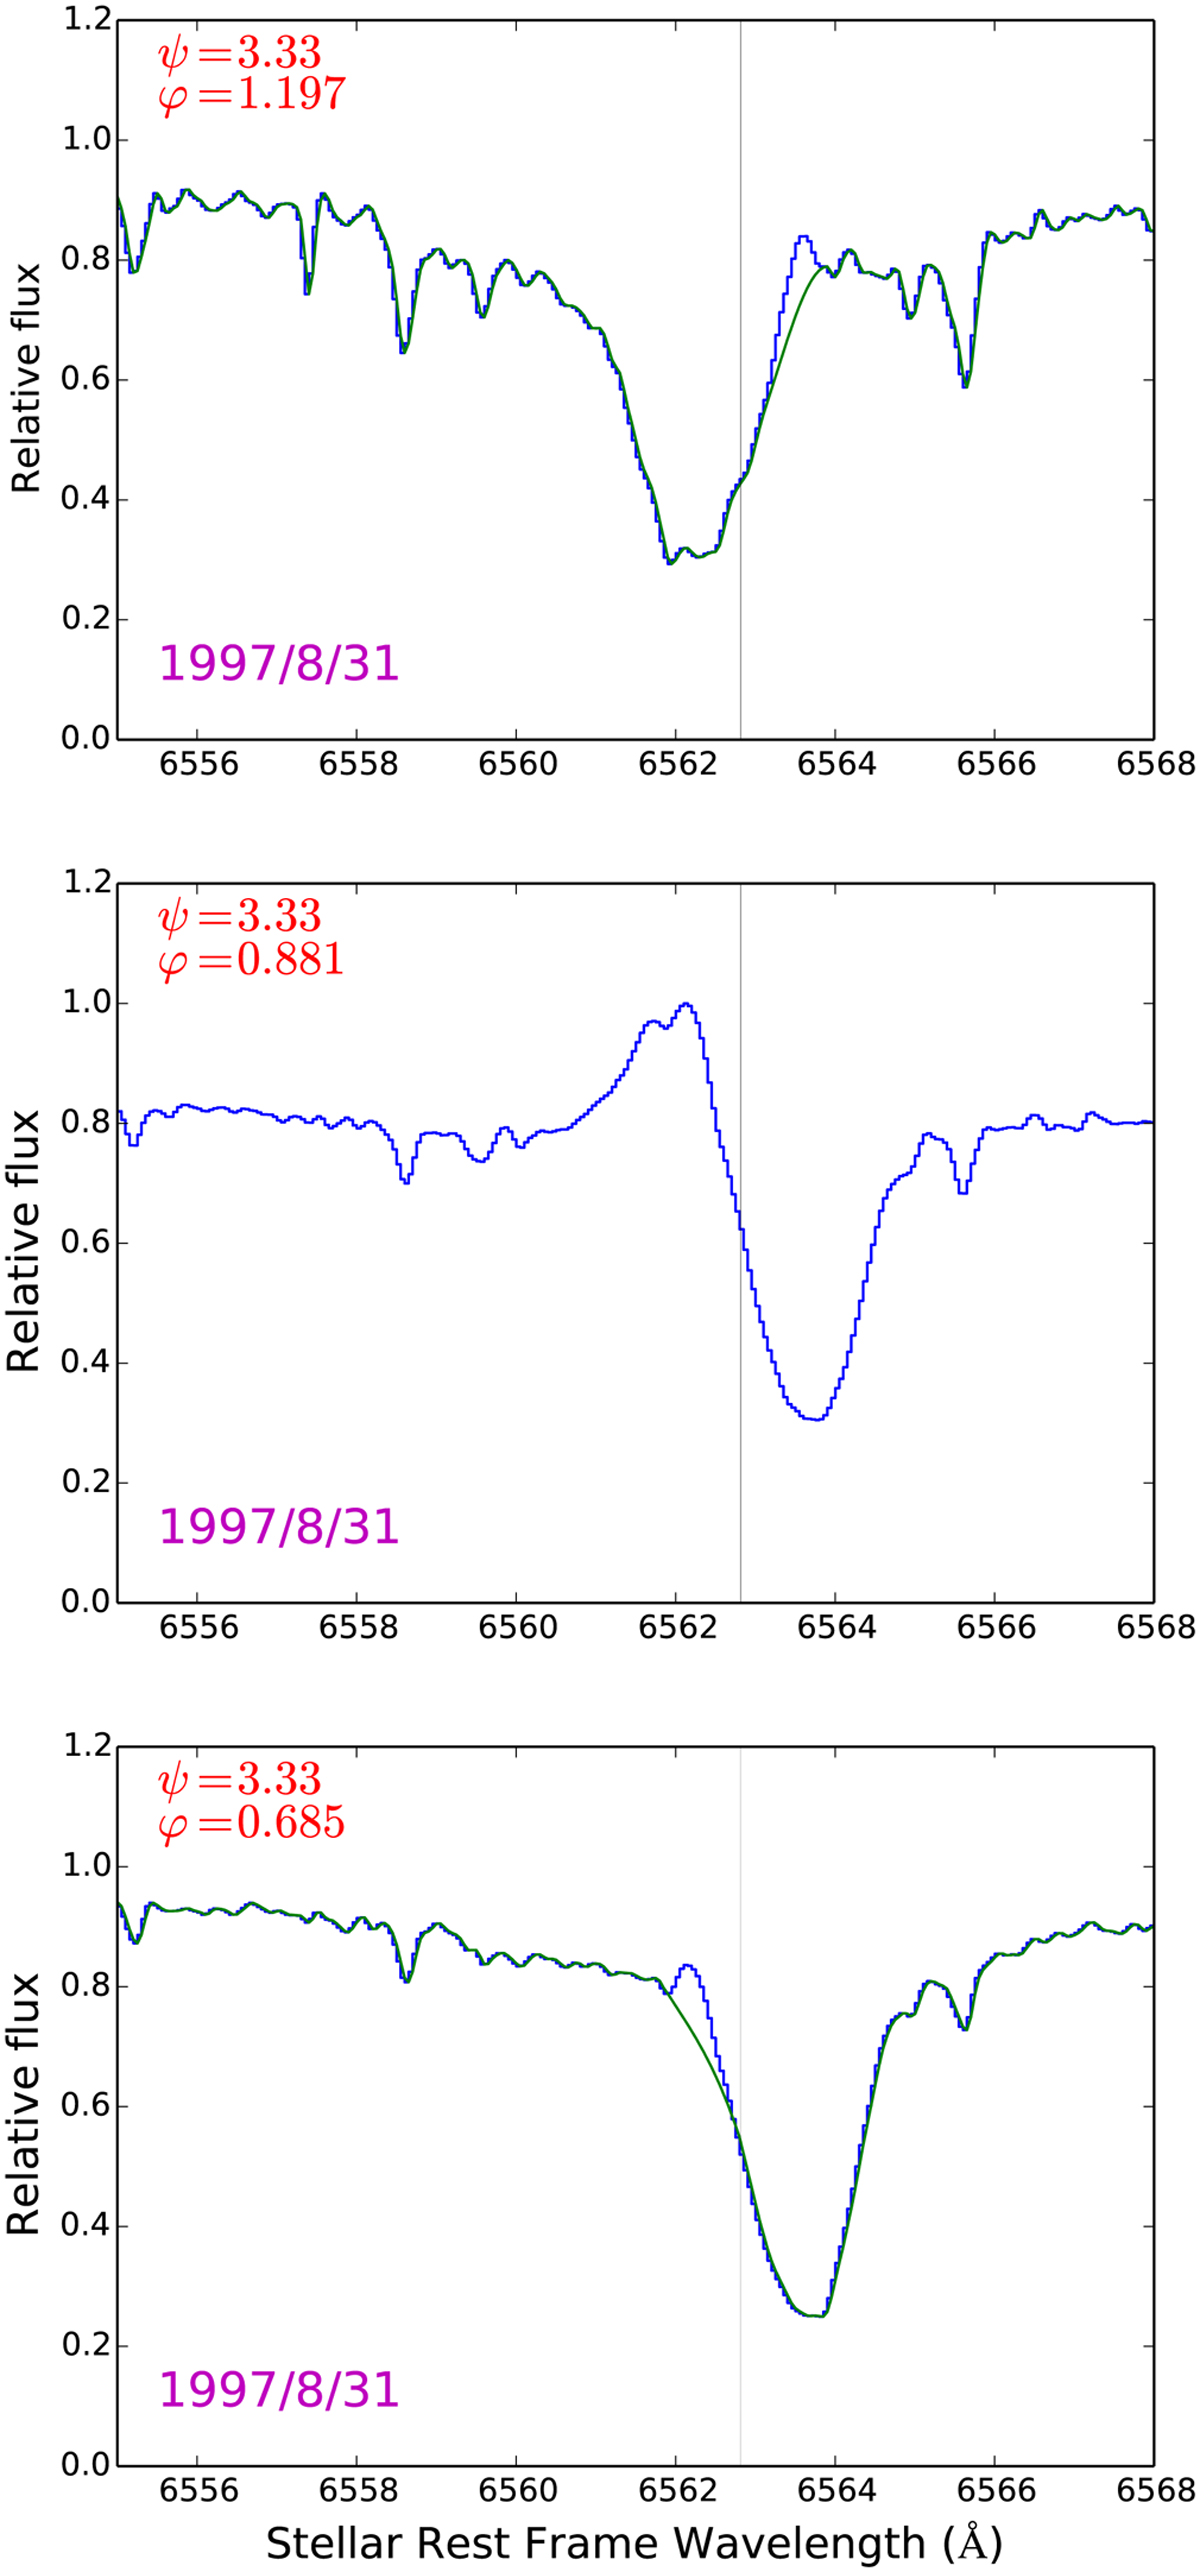
Second (up), first (middle), and third (down) apparitions of the emission that occurred in the large photospheric absorption profile of Hα during the night of August 31, 1997. The fitting of the spectrum makes it possible to highlight the two smallest emissions. The Blazhko phase, ψ, and the pulsation phase, φ, are given in the left upper corner. The laboratory wavelength is marked by a vertical line.
Current usage metrics show cumulative count of Article Views (full-text article views including HTML views, PDF and ePub downloads, according to the available data) and Abstracts Views on Vision4Press platform.
Data correspond to usage on the plateform after 2015. The current usage metrics is available 48-96 hours after online publication and is updated daily on week days.
Initial download of the metrics may take a while.