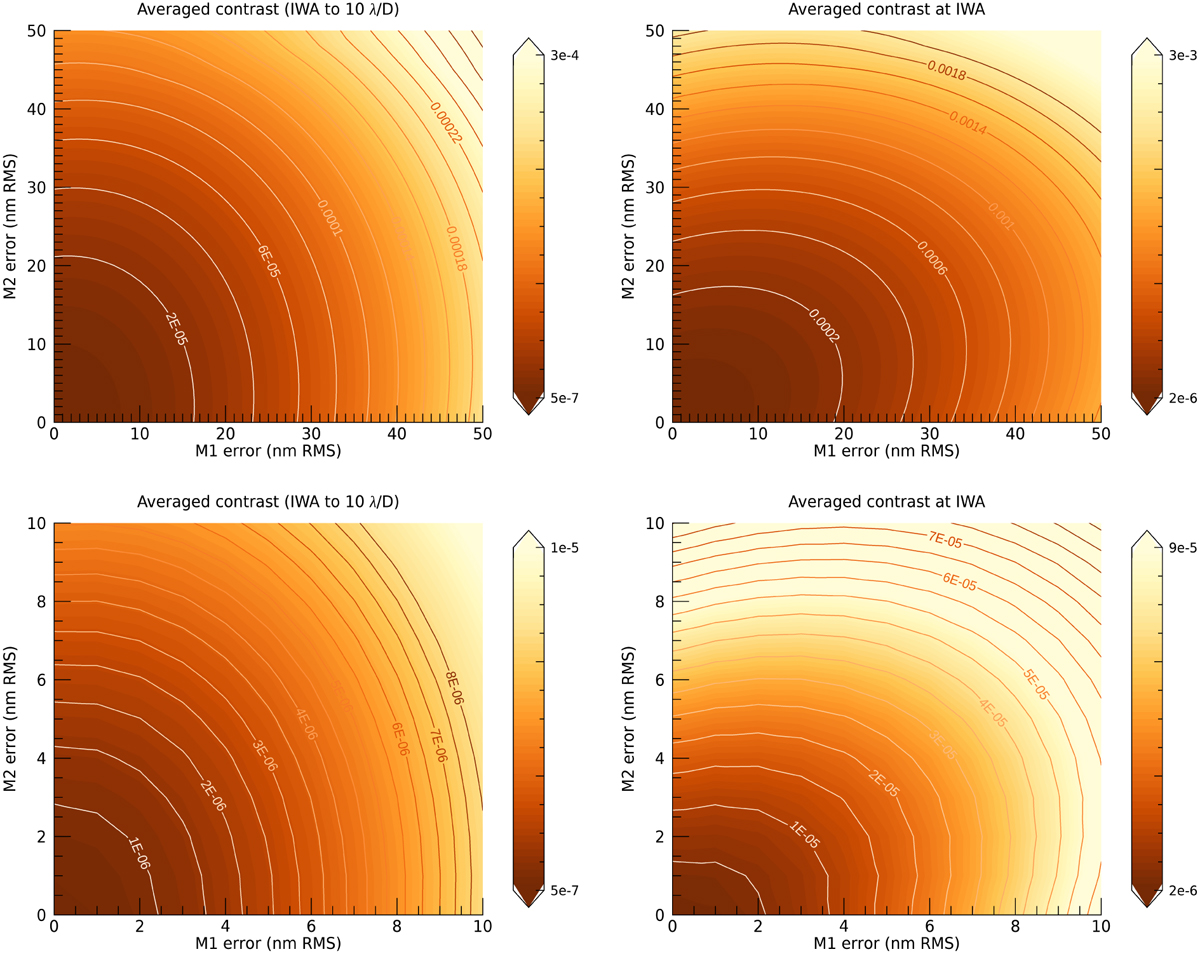
Fig. 15
Download original image
Contour plots presenting contrast evaluated from IWA to OWA (left images) and at IWA in a ring of λ/D (figures on the right) as a function of M1 and M2 errors expressed in nm RMS. Color bars are given as an indication only. To convert RMS to PV errors, in our modeled error maps, PV error is higher than the RMS error by a factor of 7 for M1 and 5 for M2.
Current usage metrics show cumulative count of Article Views (full-text article views including HTML views, PDF and ePub downloads, according to the available data) and Abstracts Views on Vision4Press platform.
Data correspond to usage on the plateform after 2015. The current usage metrics is available 48-96 hours after online publication and is updated daily on week days.
Initial download of the metrics may take a while.