Fig. 5

Download original image
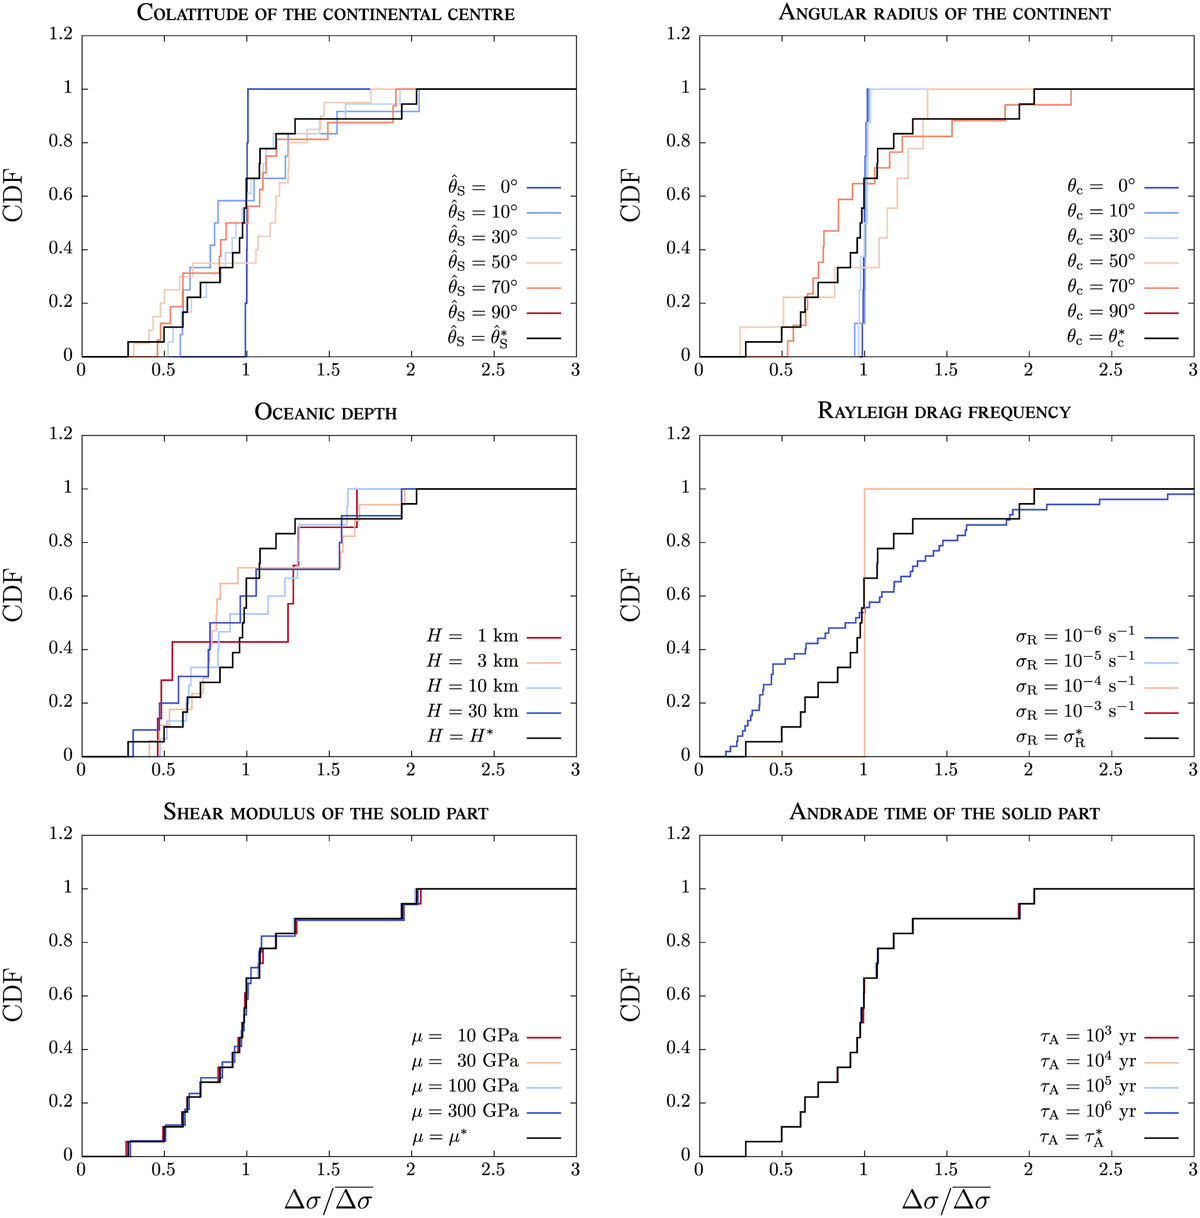
CDF of the frequency intervals separating two consecutive relative maxima in the spectra of Fig. 4. Top: variation of the colatitude of the continental centre (left panel) and continental angular radius at constant seawater volume (right panel). Middle: variation of the oceanic depth (left panel) and Rayleigh drag frequency (right panel). Bottom: variation of the effective shear modulus (left panel) and Andrade time (right panel) of the solid part. For each spectrum, the frequency intervals are normalised by their average, and the CDF is normalised. The solid black line designates the reference case defined by Table 2: ![]() ,
, ![]() , H* = 4.0 km,
, H* = 4.0 km, ![]() , μ* = 25.1189 GPa, and
, μ* = 25.1189 GPa, and ![]() .
.
Current usage metrics show cumulative count of Article Views (full-text article views including HTML views, PDF and ePub downloads, according to the available data) and Abstracts Views on Vision4Press platform.
Data correspond to usage on the plateform after 2015. The current usage metrics is available 48-96 hours after online publication and is updated daily on week days.
Initial download of the metrics may take a while.


