Fig. 3

Download original image
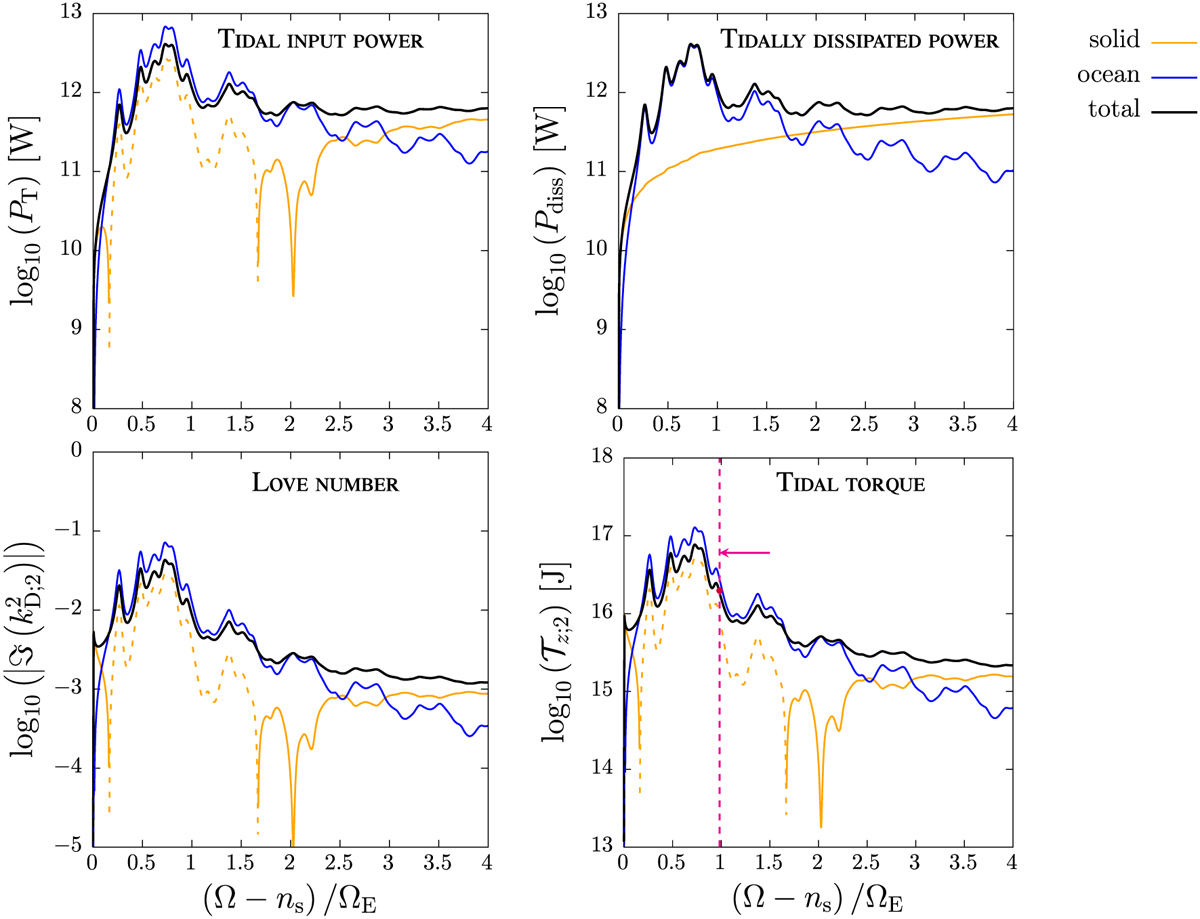
Frequency spectra of tidal quantities and their components for the reference case (Table 2) and the semidiurnal tide. Top: Tidal input power (left panel) and tidally dissipated power (right panel). Bottom: Imaginary part of the quadrupolar Love number (left panel) and tidal torque exerted about the planet’s spin axis (right panel). All quantities are plotted in logarithmic scale (vertical axis) as functions of the normalised semidiurnal tidal frequency χ = (Ω − ns) /ΩΕ (horizontal axis). In each plot, the orange, blue and black lines designate the response of the solid part, ocean, and whole planet, respectively. Solid lines indicate decelerating tidal torque (![]() and 𝒯z;2 ≤ 0) and positive tidal input power (𝒫T ≥ 0), while dashed lines indicate accelerating tidal torque
and 𝒯z;2 ≤ 0) and positive tidal input power (𝒫T ≥ 0), while dashed lines indicate accelerating tidal torque ![]() and 𝒯z;2 > 0) and negative tidal input power (𝒫T < 0). In the plot of the tidal torque, the magenta vertical dashed line and arrow indicate the position of the present day Earth in the spectrum and the direction of evolution of the semidiurnal tidal frequency, respectively. The red dot designates the corresponding tidal torque.
and 𝒯z;2 > 0) and negative tidal input power (𝒫T < 0). In the plot of the tidal torque, the magenta vertical dashed line and arrow indicate the position of the present day Earth in the spectrum and the direction of evolution of the semidiurnal tidal frequency, respectively. The red dot designates the corresponding tidal torque.
Current usage metrics show cumulative count of Article Views (full-text article views including HTML views, PDF and ePub downloads, according to the available data) and Abstracts Views on Vision4Press platform.
Data correspond to usage on the plateform after 2015. The current usage metrics is available 48-96 hours after online publication and is updated daily on week days.
Initial download of the metrics may take a while.


