Open Access
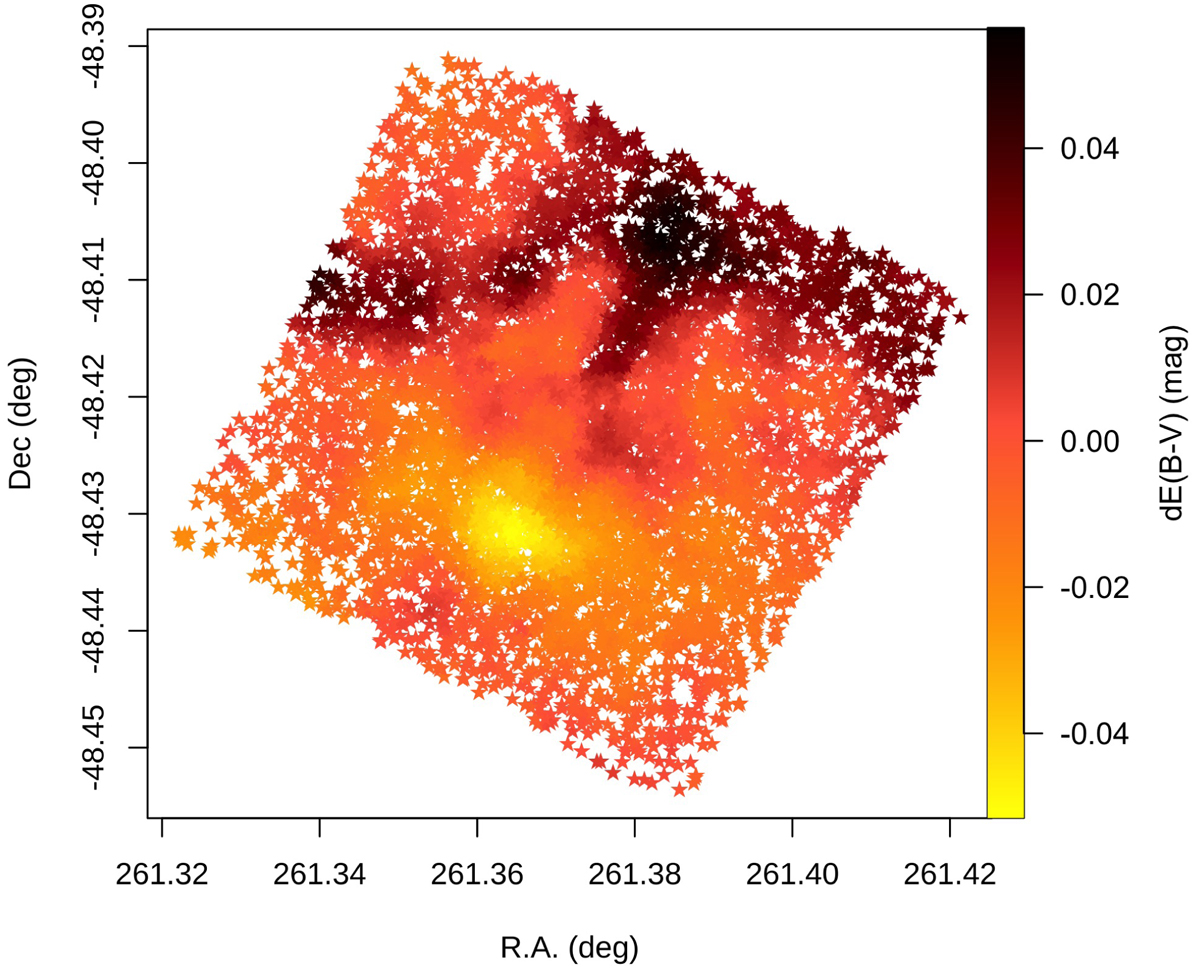
Fig. 3.
Download original image
Example of a differential reddening map for NGC 6352. Each of the stars used to compute the differential reddening correction is plotted in sky coordinates and coloured according to its value of dE(B − V).
Current usage metrics show cumulative count of Article Views (full-text article views including HTML views, PDF and ePub downloads, according to the available data) and Abstracts Views on Vision4Press platform.
Data correspond to usage on the plateform after 2015. The current usage metrics is available 48-96 hours after online publication and is updated daily on week days.
Initial download of the metrics may take a while.