Fig. F.2
Download original image
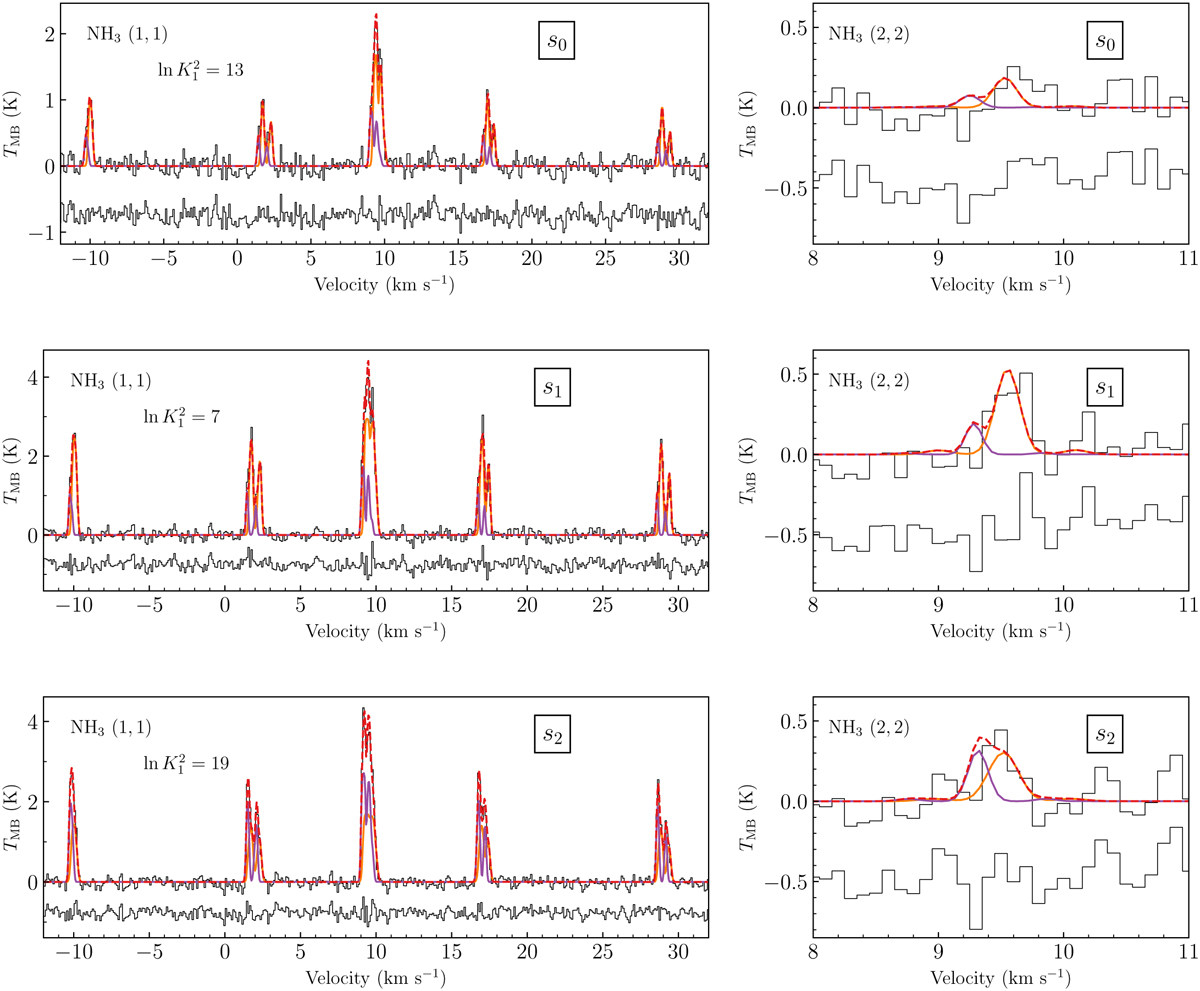
Example of two-component spectra towards S1, S2 and S3 regions of L694-2 as in Fig. F.1 (cyan pluses), of the NH3 (1,1) and (2,2) lines. Red dashed lines show the overall two-component fit; orange and magenta lines shows the two components separately. The offset spectra show the residual of observed spectra minus the two-component model spectra.
Current usage metrics show cumulative count of Article Views (full-text article views including HTML views, PDF and ePub downloads, according to the available data) and Abstracts Views on Vision4Press platform.
Data correspond to usage on the plateform after 2015. The current usage metrics is available 48-96 hours after online publication and is updated daily on week days.
Initial download of the metrics may take a while.