Open Access
Fig. E.1
Download original image
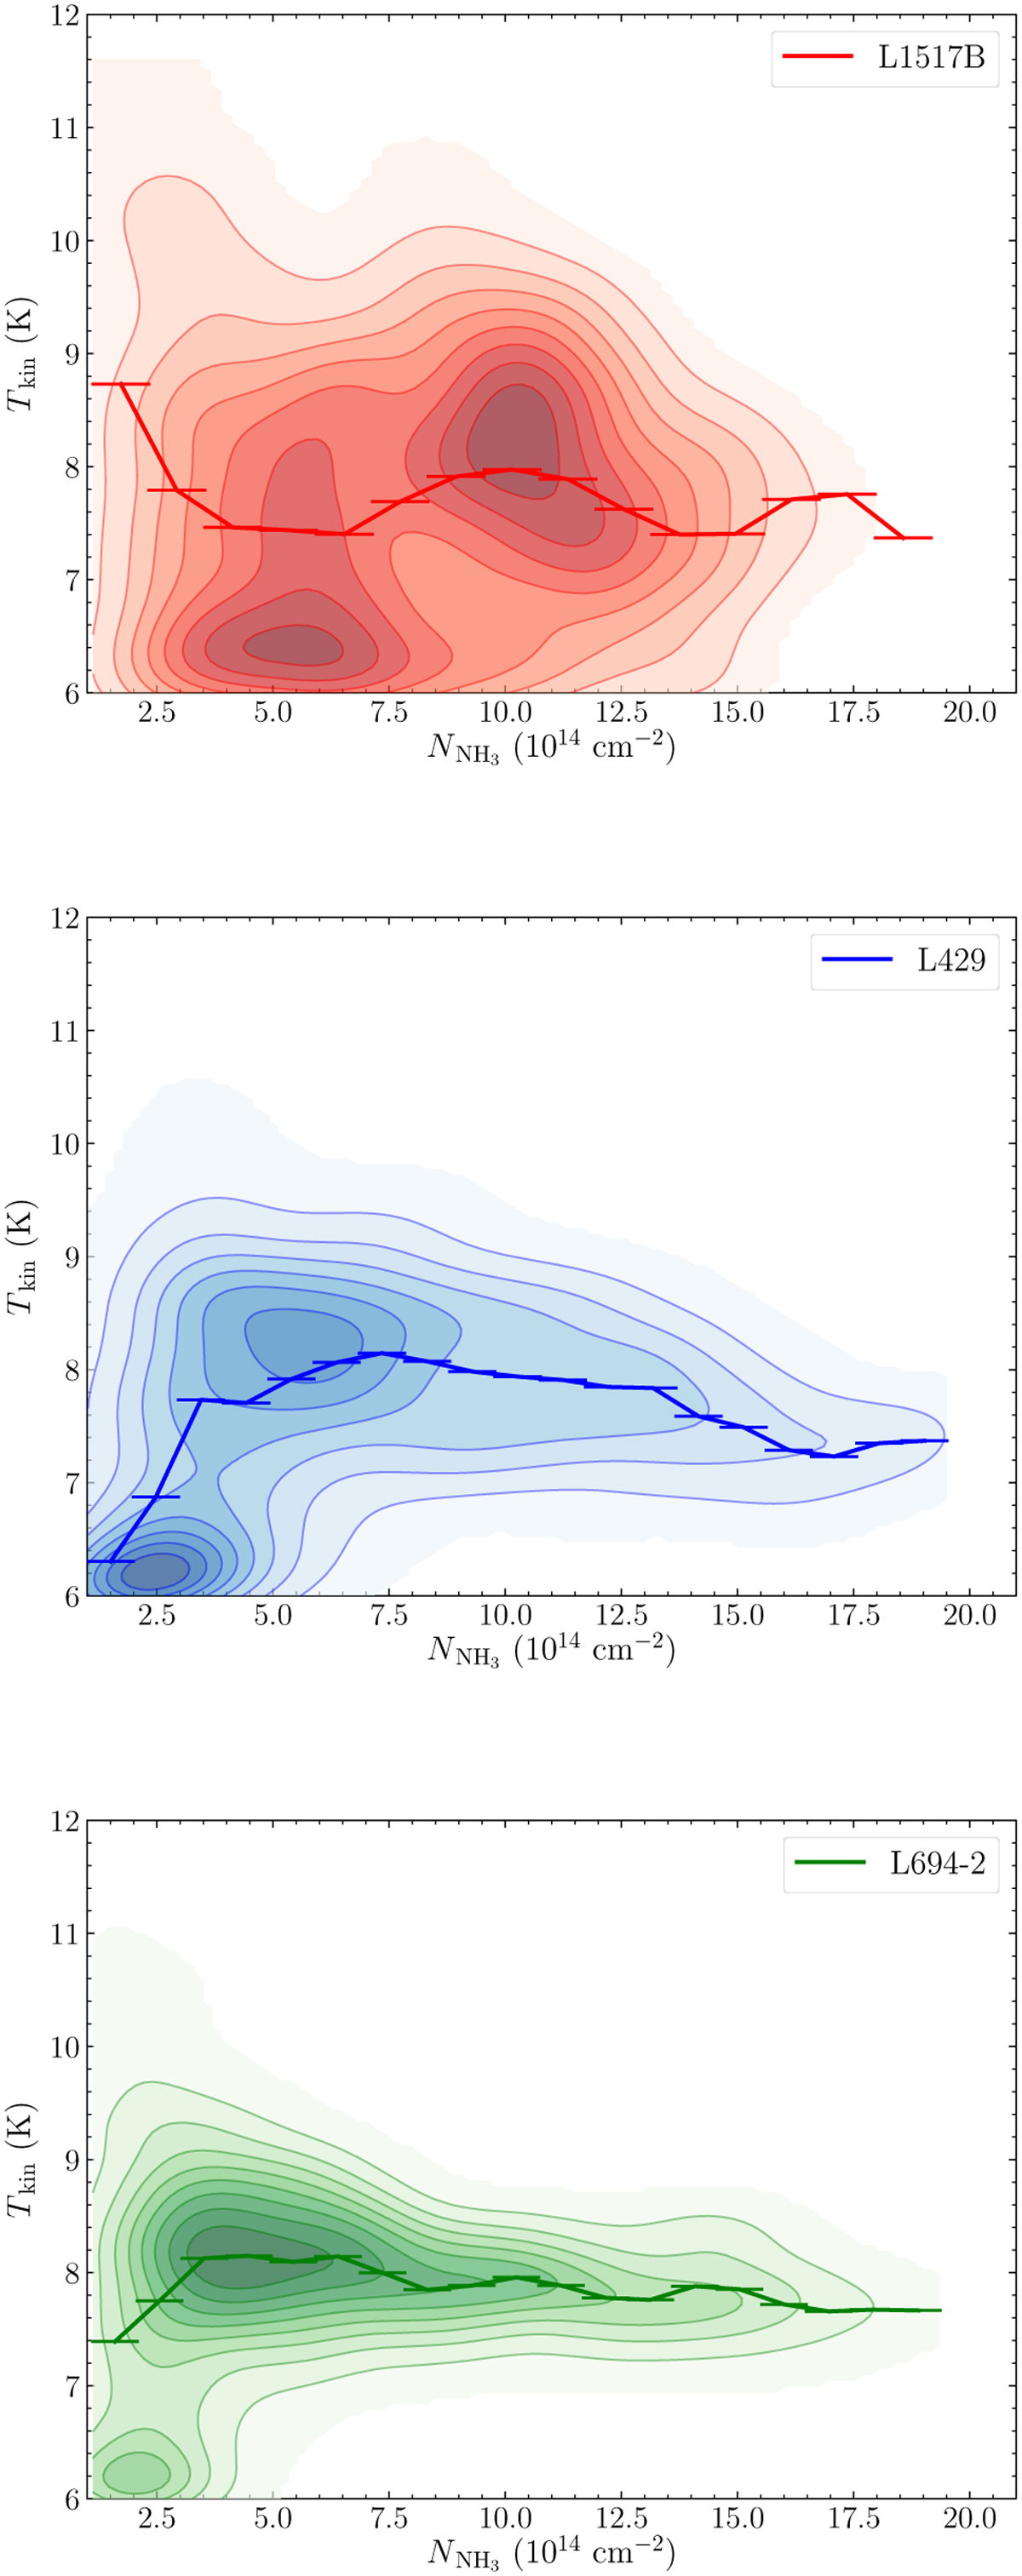
Kinetic temperature as a function of NH3 column density for the three cores. Both quantities are derived from VLA data cube without combining with GBT data (as compared to right panel of Fig. 6). The line segments correspond to mean values in H2 column density bins, which are linked together.
Current usage metrics show cumulative count of Article Views (full-text article views including HTML views, PDF and ePub downloads, according to the available data) and Abstracts Views on Vision4Press platform.
Data correspond to usage on the plateform after 2015. The current usage metrics is available 48-96 hours after online publication and is updated daily on week days.
Initial download of the metrics may take a while.