Fig. D.1
Download original image
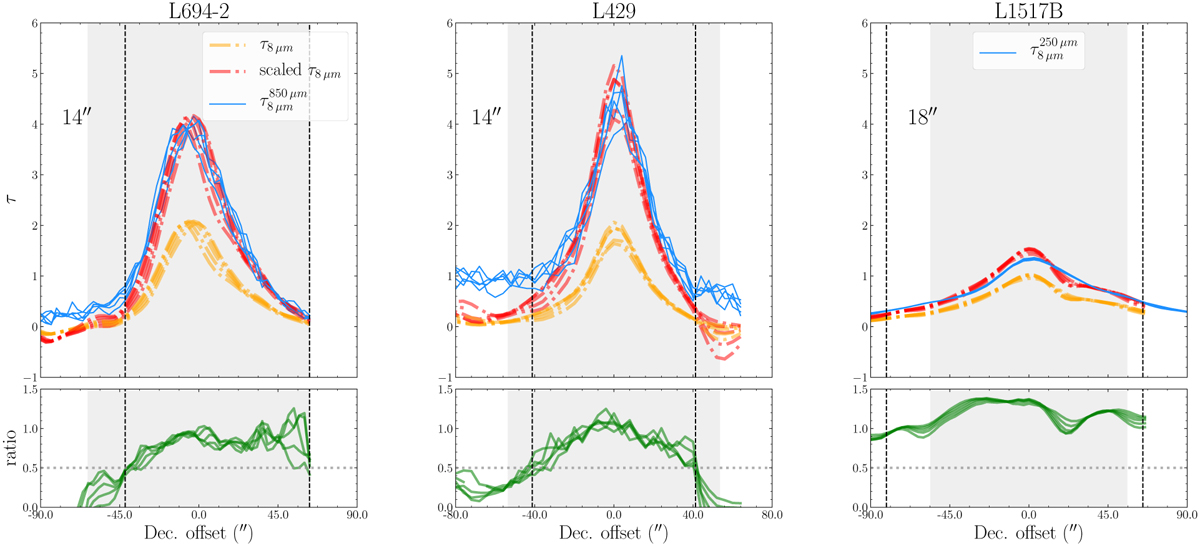
Comparison between profiles (along Declination) of opacity maps, extracted from original τ8 µm map, and that predicted from τ850 µm (denoted as ![]() µm) or τ250 µm in the case of L1517B, and the scaled-up τ8.µm map. The two versions of τ8 µm map are both smoothed to 14″ (18″) to match the angular resolution of the τ850 µm (τ250 µm) map. The lower panel shows the ratios between scaled-up τ8 µm and
µm) or τ250 µm in the case of L1517B, and the scaled-up τ8.µm map. The two versions of τ8 µm map are both smoothed to 14″ (18″) to match the angular resolution of the τ850 µm (τ250 µm) map. The lower panel shows the ratios between scaled-up τ8 µm and ![]() µm (
µm (![]() ). The grey shaded region indicates the effective radius of the final trimmed parameter maps of NH3. Vertical dotted lines show the offset where the ratio drops below 0.5 (indicated by the horizontal dotted line).
). The grey shaded region indicates the effective radius of the final trimmed parameter maps of NH3. Vertical dotted lines show the offset where the ratio drops below 0.5 (indicated by the horizontal dotted line).
Current usage metrics show cumulative count of Article Views (full-text article views including HTML views, PDF and ePub downloads, according to the available data) and Abstracts Views on Vision4Press platform.
Data correspond to usage on the plateform after 2015. The current usage metrics is available 48-96 hours after online publication and is updated daily on week days.
Initial download of the metrics may take a while.