Open Access
Fig. C.1
Download original image
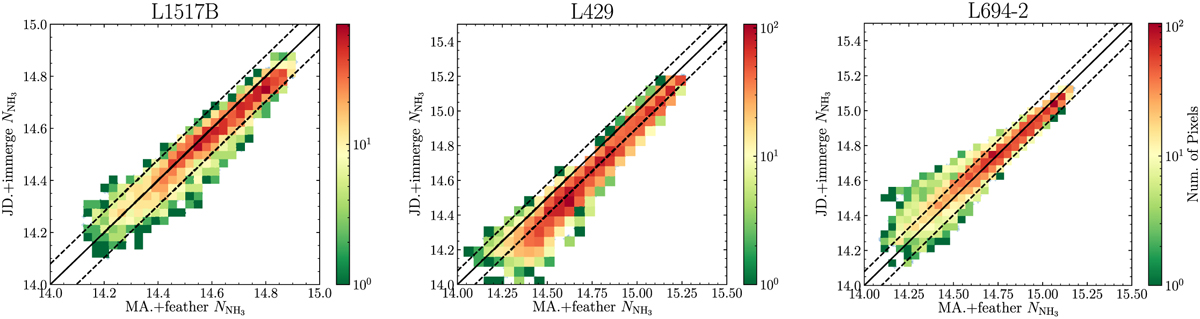
2D histogram of comparison between fitted N(NH3) of different combined data products: one based on joint-deconvolution (JD) and immerge using Miriad and the other model-assisted (MA) multi-scale clean plus feather using CASA. The diagonal dashed and solid lines indicate a factor of 1.2, 1, and 0.8 differences.
Current usage metrics show cumulative count of Article Views (full-text article views including HTML views, PDF and ePub downloads, according to the available data) and Abstracts Views on Vision4Press platform.
Data correspond to usage on the plateform after 2015. The current usage metrics is available 48-96 hours after online publication and is updated daily on week days.
Initial download of the metrics may take a while.