Fig. 1
Download original image
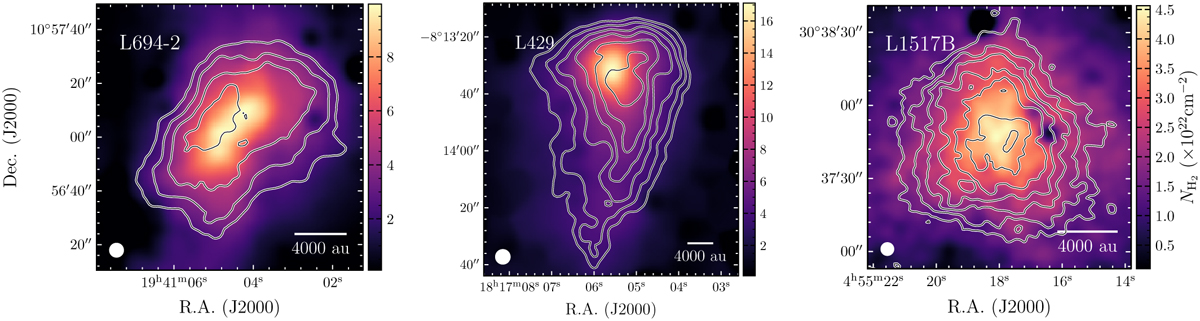
Hydrogen column density maps (N(H2)) derived from Spitzer 8 μm extinction. The contours show the integrated intensity map of the main component of NH3 (1,1) line. The void regions in L694-2 and L1517B of very low N(H2) correspond to nearby bright point 8 μm sources. The beam size is indicated as a white filled circle in each figure. For L694-2 and L429 the contours start from 1 K km s−1 and 1.5 K km s−1, respectively, with a spacing of 0.5 K km s−1. For L1517B the contours start from 0.5 K km s−1 with a spacing of 0.3 K km s−1.
Current usage metrics show cumulative count of Article Views (full-text article views including HTML views, PDF and ePub downloads, according to the available data) and Abstracts Views on Vision4Press platform.
Data correspond to usage on the plateform after 2015. The current usage metrics is available 48-96 hours after online publication and is updated daily on week days.
Initial download of the metrics may take a while.