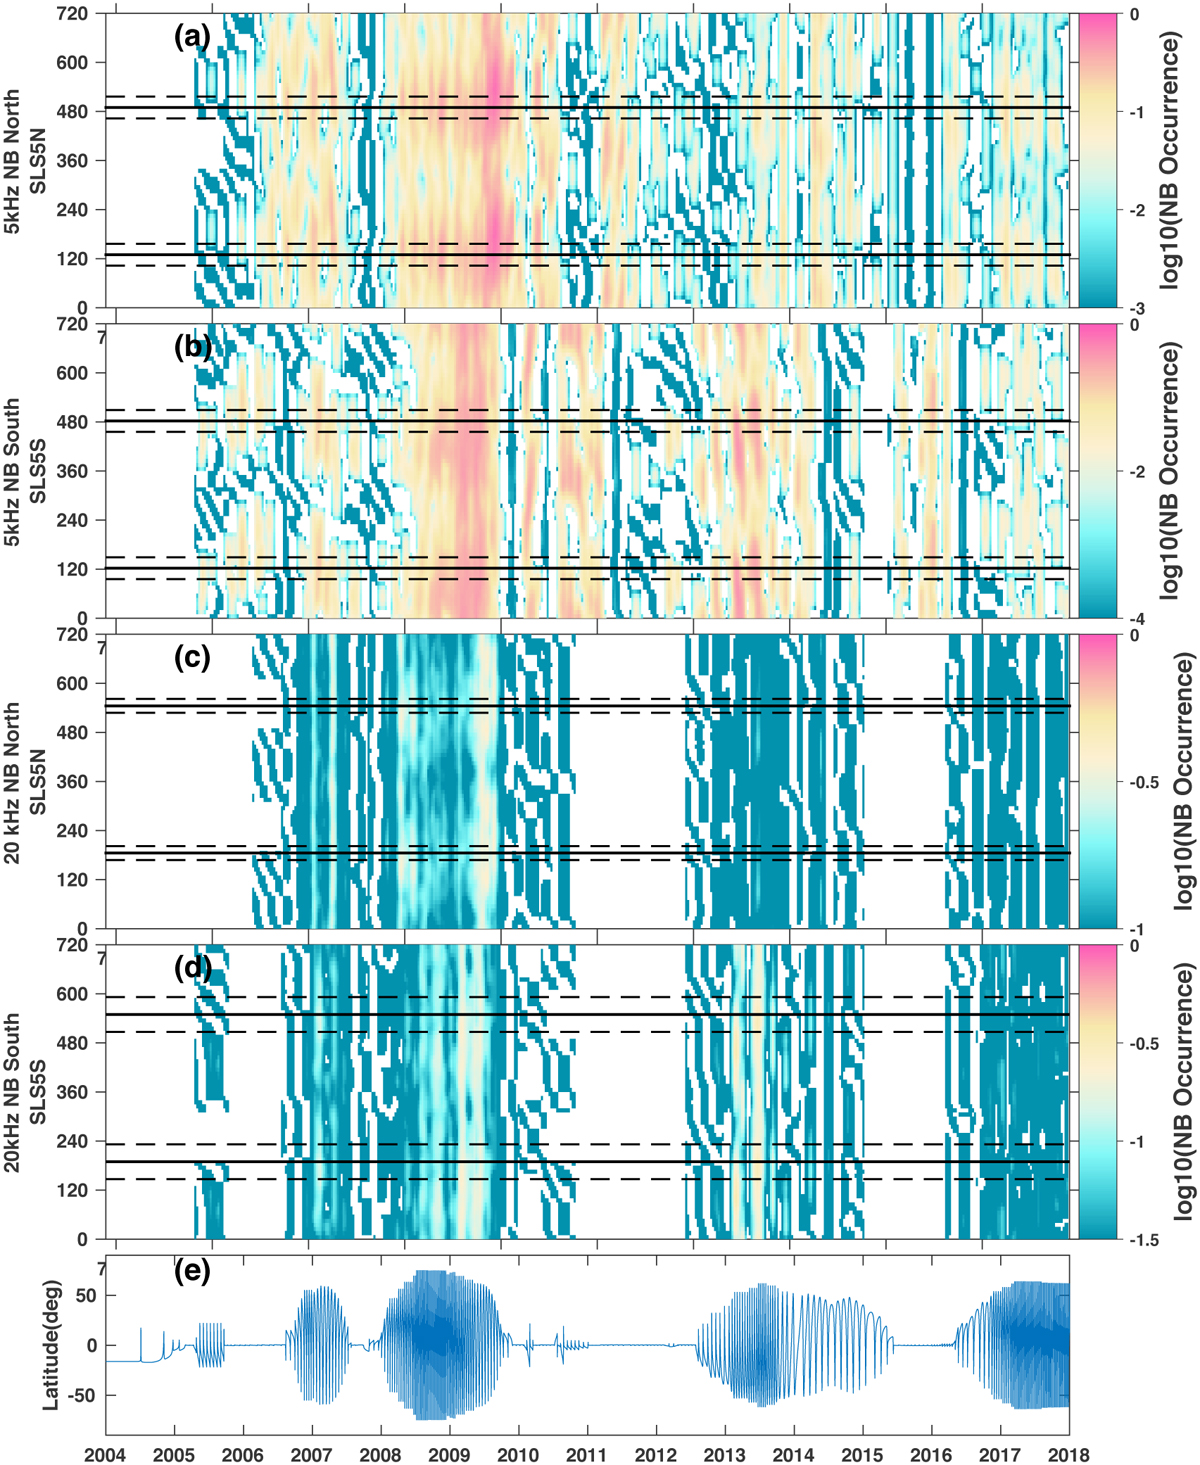
Fig. A.1
Download original image
Occurrence phase of the NB emissions in SKR longitude systems. Panels (a)-(b) give the northern and southern hemisphere 5 kHz NB emission occurrences in the SKR derived longitude systems (SLS5-N and SLS5-S). The color code represents the averaged occurrence of the NB emissions in the corresponding time and longitude. The solid and dashed black lines represent the mean and one sigma deviation values derived in Fig. 4. Two rotation periods of the results are shown in each panel in order to give clearer illustrations. The northern and southern events of both the 5 kHz NB and 20 kHz NB are simply separated by choosing Lat > 0° or Lat <0°. Panels (c)-(d) present the northern and southern hemisphere 20 kHz NB emission occurrences in the SKR derived longitude systems (SLS5-N and SLS5-S). Panel (e) shows the Cassini latitude from 2004 to 2017.
Current usage metrics show cumulative count of Article Views (full-text article views including HTML views, PDF and ePub downloads, according to the available data) and Abstracts Views on Vision4Press platform.
Data correspond to usage on the plateform after 2015. The current usage metrics is available 48-96 hours after online publication and is updated daily on week days.
Initial download of the metrics may take a while.