Fig. 5
Download original image
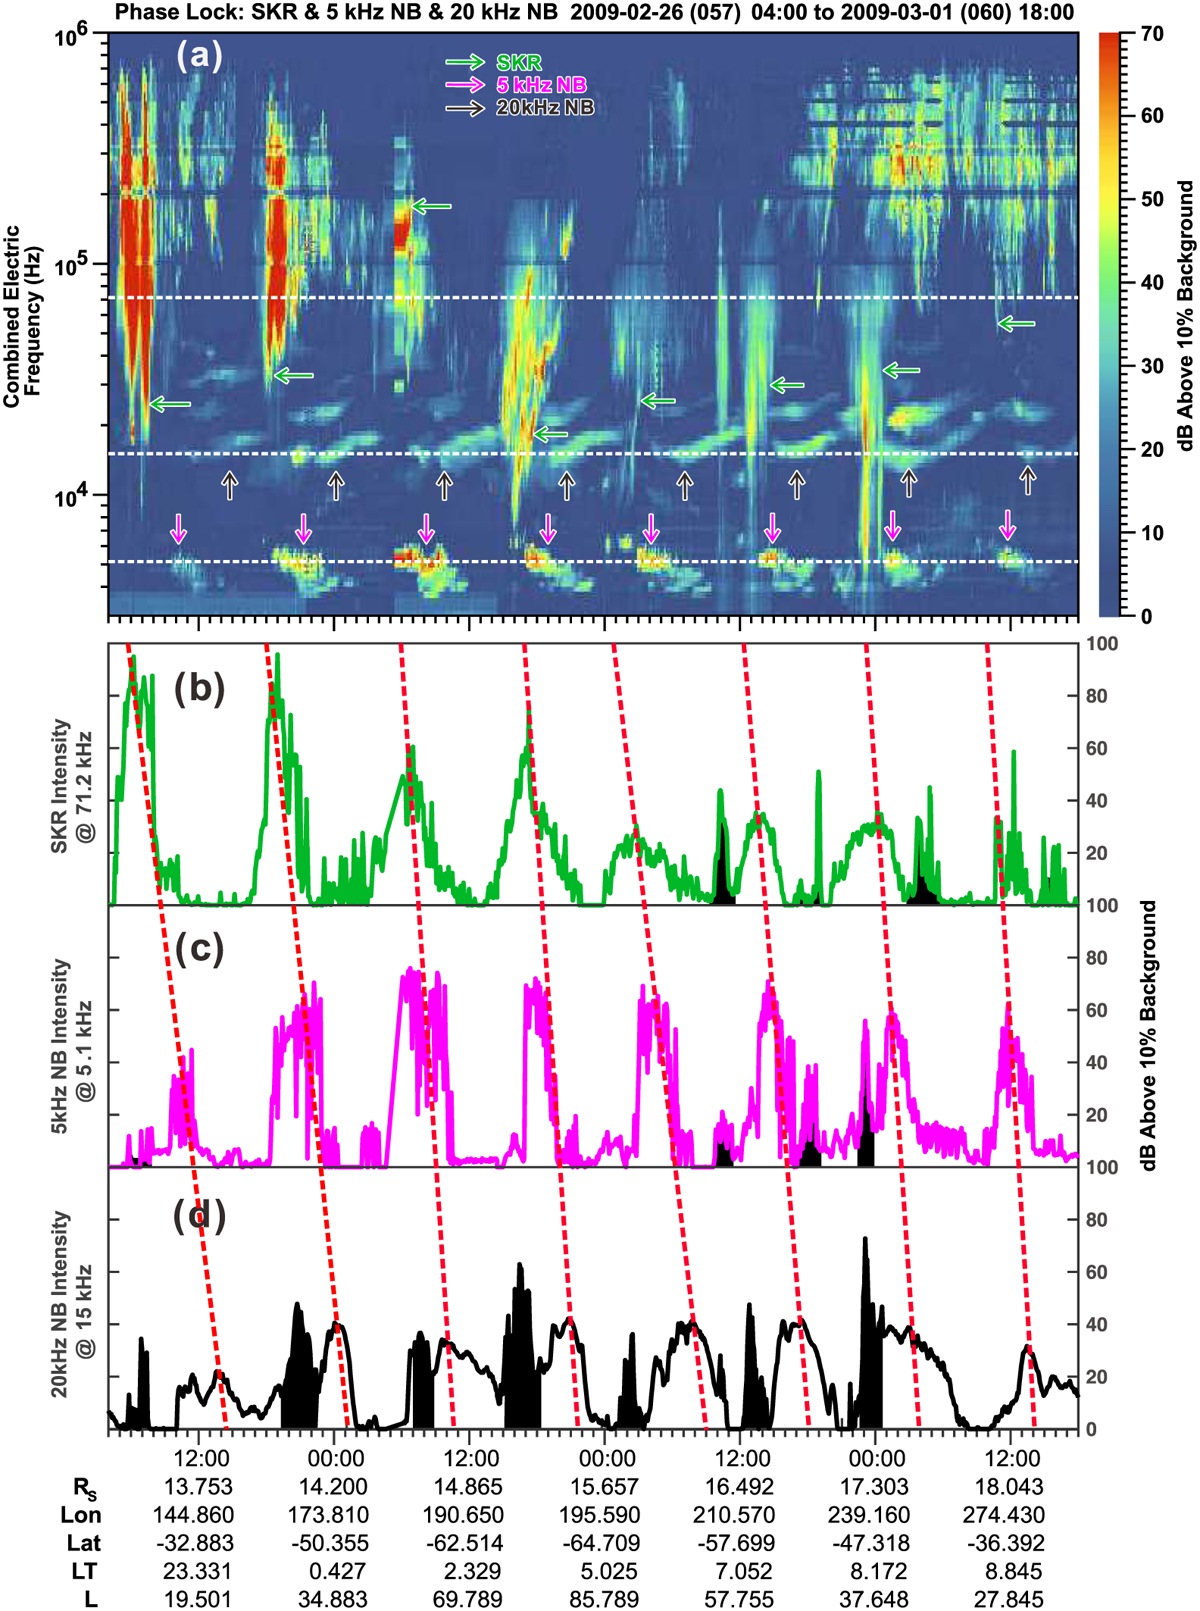
Relative phase of the Saturn radio emissions. Panel a: Cassini RPWS wave electric field spectrogram. The horizontal white dashed lines mark the frequencies of 71.2 kHz (corresponding to SKR), 15 kHz (corresponding to 20 kHz NB), and 5.1 kHz (corresponding to 5 kHz NB), which are used in the following panels to plot the frequency intensity versus time variation. The blue, pink, and black arrows in panel a indicate the three radio emissions. Panels b–d: spectral density in units of dB above the background. The oblique red dashed lines depict the rough phase relation between the three radio emissions. The peaks marked by the oblique red dashed lines correspond to the blue, pink, and black arrows in panel a, which correspond to the main emissions of SKR, 5 kHz NB, and 20 kHz NB. The black shaded regions in panels b–d indicate the regions that are polluted by the low-frequency extensions of SKR. The relatively constant relations shown suggest a phase-lock situation.
Current usage metrics show cumulative count of Article Views (full-text article views including HTML views, PDF and ePub downloads, according to the available data) and Abstracts Views on Vision4Press platform.
Data correspond to usage on the plateform after 2015. The current usage metrics is available 48-96 hours after online publication and is updated daily on week days.
Initial download of the metrics may take a while.