Fig. 3
Download original image
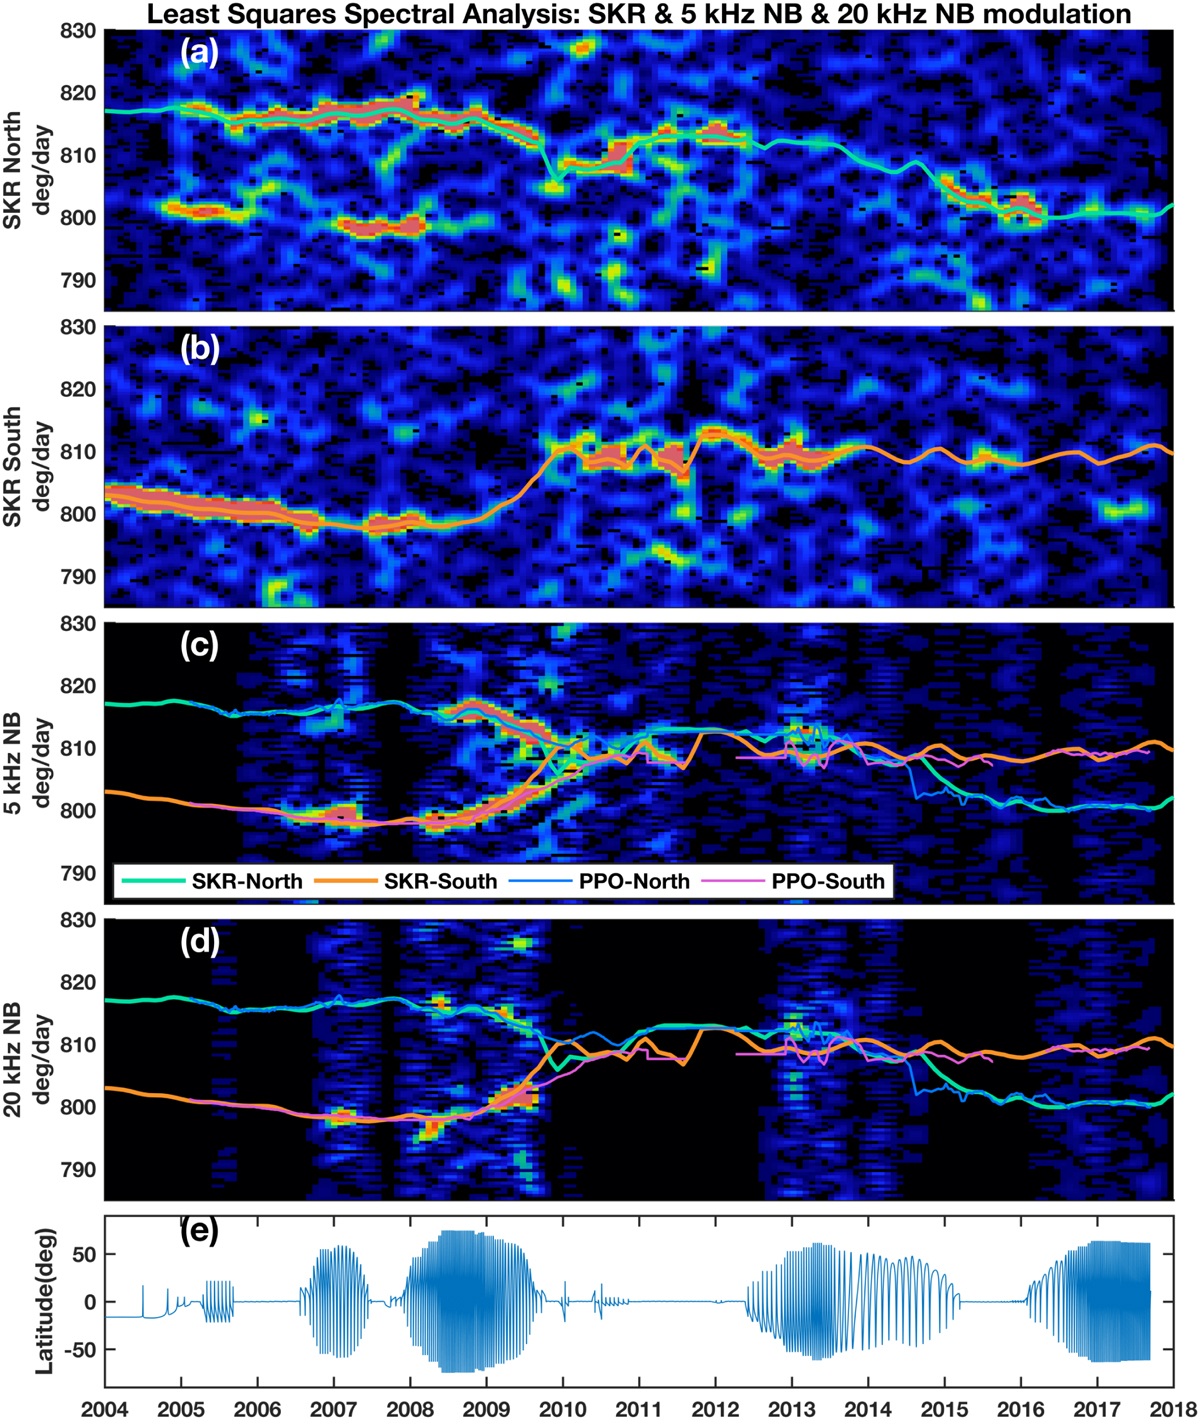
Least-squares spectral analysis spectrograms of Saturn radio emissions from 2004 to 2018. The color-coded spectrograms show the modulation power as a function of universal time in the horizontal axis and the modulation rate in the vertical axis. Panels a–d respectively show the results for the northern hemisphere SKR, the southern hemisphere SKR, the 5 kHz NB emissions (in both hemispheres), and the 20 kHz NB emissions (in both hemispheres). Panel e shows the Cassini latitudes during its Saturn orbital journey. The green and orange lines are the northern and southern SKR periods as derived by Ye et al. (2018). The blue and pink lines are the northern and southern PPO periods as derived by Provan et al. (2013, 2016, 2019).
Current usage metrics show cumulative count of Article Views (full-text article views including HTML views, PDF and ePub downloads, according to the available data) and Abstracts Views on Vision4Press platform.
Data correspond to usage on the plateform after 2015. The current usage metrics is available 48-96 hours after online publication and is updated daily on week days.
Initial download of the metrics may take a while.