Fig. 1
Download original image
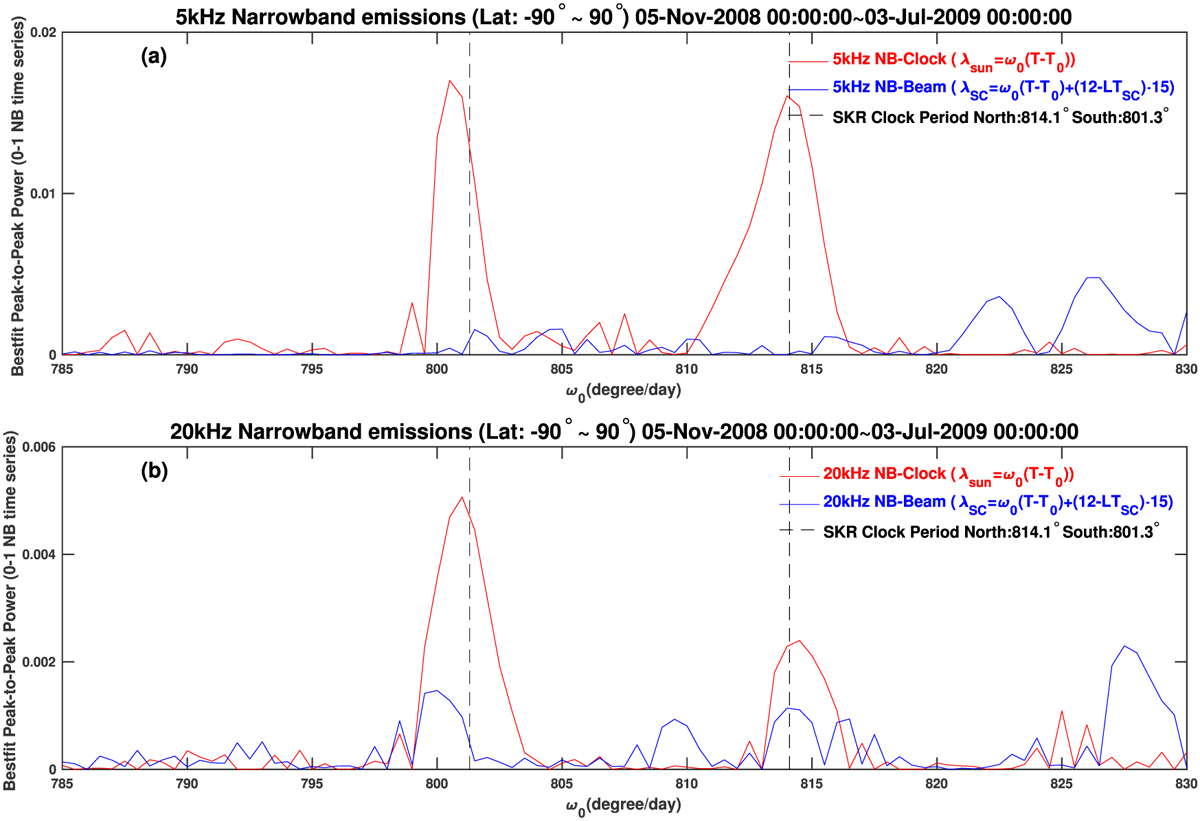
Clock-like modulation of NB emissions. Panel a: clock or rotating beam test for 5 kHz NB. The horizontal axis of ω0 encompasses the assumed modulation rates of 785 to 830° per day, which was chosen to be near the rotation rate of Saturn (10.7 hours = 807° per day). The vertical axis is the fitted peak-to-peak modulation power giving the fitted peak power of the 240-day time series under the assumption of each ω0. The two solid lines show the modulation rates of 5 kHz NB emissions under the assumption of a clock-like source (red) and a rotating beam source (blue). Panel b: similar format as panel a but for 20 kHz NB emissions. The black dashed lines mark the modulation rate in the same 240-day window derived from the SKR intensities. The 5 kHz and 20 kHz NB time series used in this window are not separated into two hemispheres according to latitude.
Current usage metrics show cumulative count of Article Views (full-text article views including HTML views, PDF and ePub downloads, according to the available data) and Abstracts Views on Vision4Press platform.
Data correspond to usage on the plateform after 2015. The current usage metrics is available 48-96 hours after online publication and is updated daily on week days.
Initial download of the metrics may take a while.