Fig. 5
Download original image
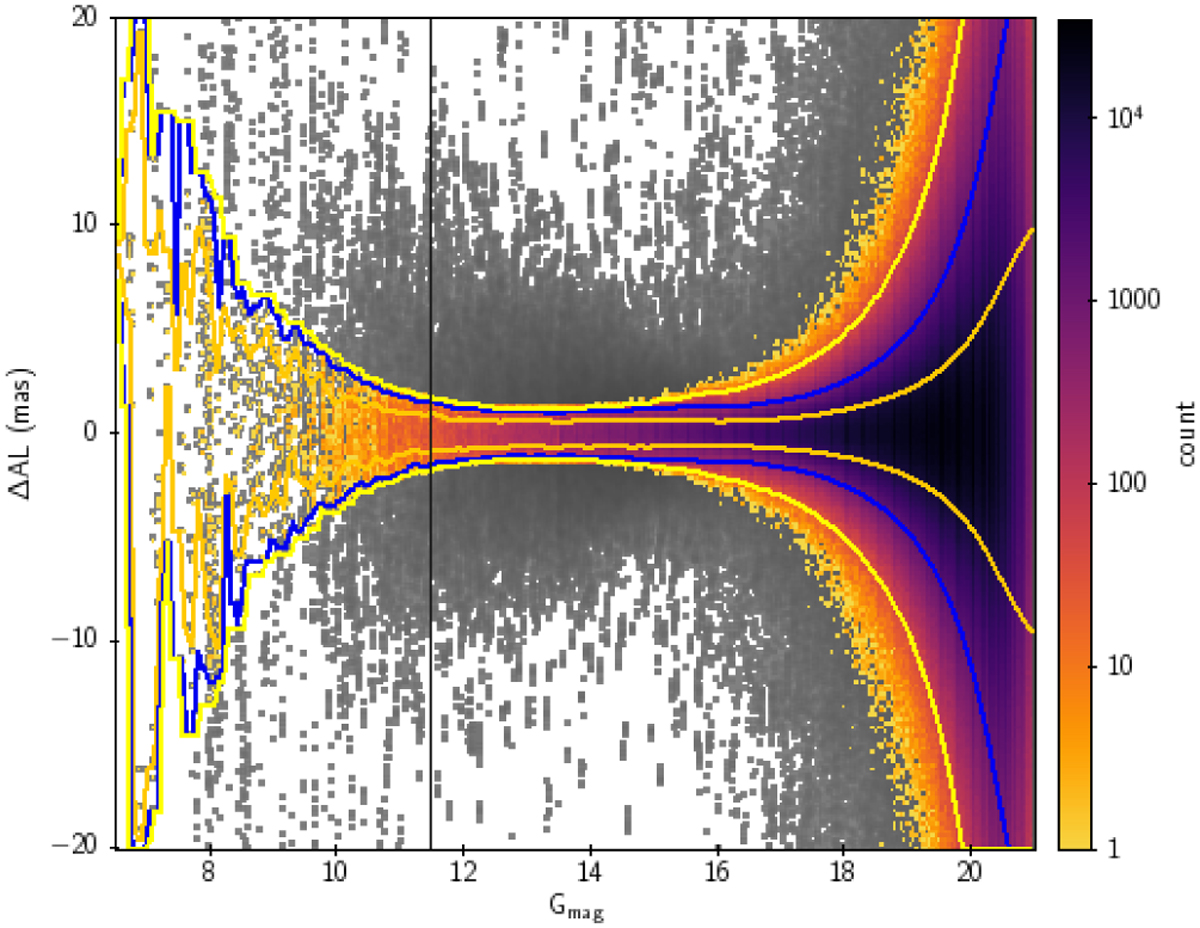
Along-scan residuals against G magnitudes. The grey points represent all observations. The coloured points are the observations that were accepted by the orbit adjustment procedure after outlier rejection chosen at |O − C| > 5 σ. For Gmag < 11.5, the distribution is not Gaussian. This is clearer in Fig. 6. For Gmag ≥ 11.5, the distribution is Gaussian. The orange lines in the plot are ±1 σ, the blue lines are ±2 σ, and the yellow lines are ±3 σ. The number density is given by the scale on the right.
Current usage metrics show cumulative count of Article Views (full-text article views including HTML views, PDF and ePub downloads, according to the available data) and Abstracts Views on Vision4Press platform.
Data correspond to usage on the plateform after 2015. The current usage metrics is available 48-96 hours after online publication and is updated daily on week days.
Initial download of the metrics may take a while.