Fig. 3
Download original image
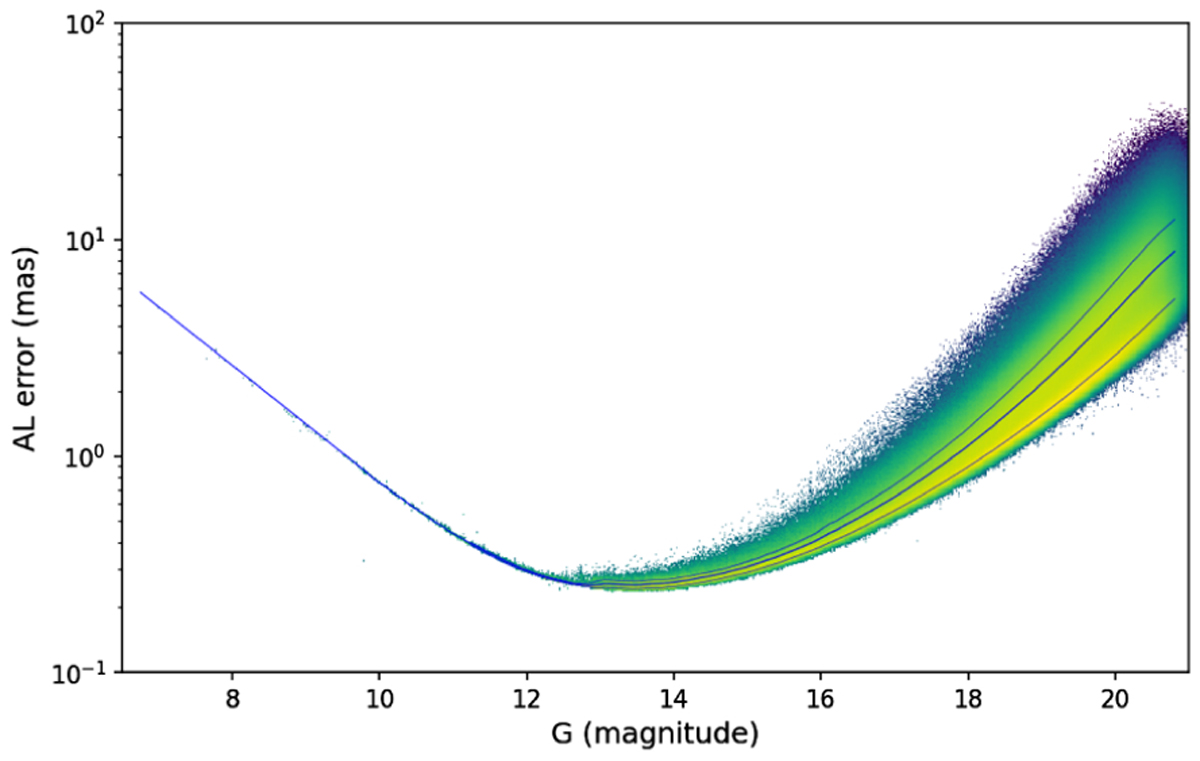
Error model in the along-scan direction for the SSO astrometry in Gaia DR3 as a function of the G magnitude. The total error is represented as given by the squared sum of the random and the systematic component. The colour represents the data density (yellow or light means a higher density). The thick line and the two thin lines on each side are the quantiles that correspond to the mean and the 1σ level.
Current usage metrics show cumulative count of Article Views (full-text article views including HTML views, PDF and ePub downloads, according to the available data) and Abstracts Views on Vision4Press platform.
Data correspond to usage on the plateform after 2015. The current usage metrics is available 48-96 hours after online publication and is updated daily on week days.
Initial download of the metrics may take a while.