Fig. 26
Download original image
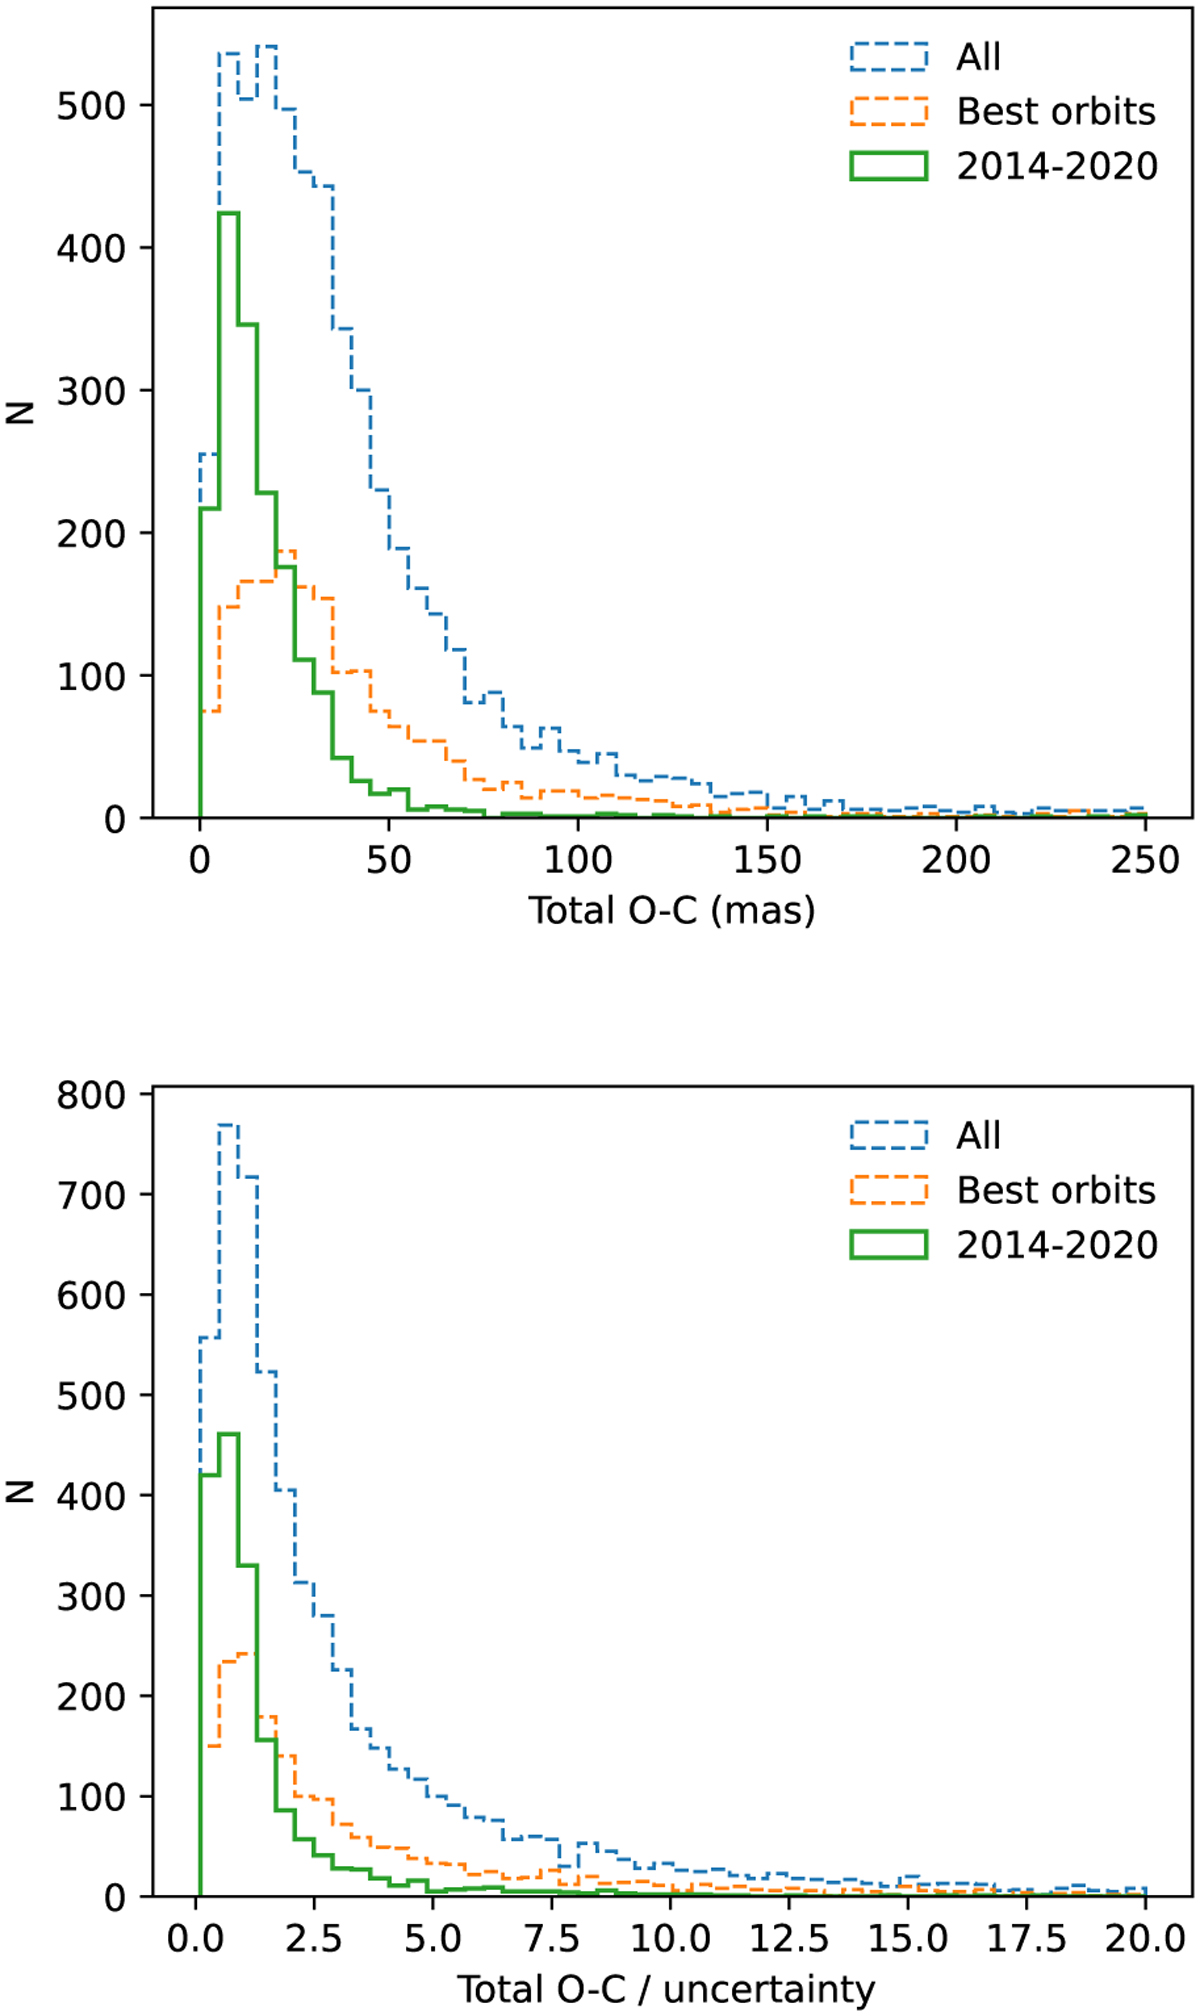
Histogram of the absolute total O–C (distance on the sky) between the predicted and observed positions derived from stellar occultations. The bottom panel presents the O–C values normalised by the uncertainty of the occultation astrometry for each event. The curve labelled “2014–2020” includes only occultations around those years, while “best orbit” considers only orbits with σα < 1.6 × 10⁻¹⁰ au.
Current usage metrics show cumulative count of Article Views (full-text article views including HTML views, PDF and ePub downloads, according to the available data) and Abstracts Views on Vision4Press platform.
Data correspond to usage on the plateform after 2015. The current usage metrics is available 48-96 hours after online publication and is updated daily on week days.
Initial download of the metrics may take a while.