Fig. 21

Download original image
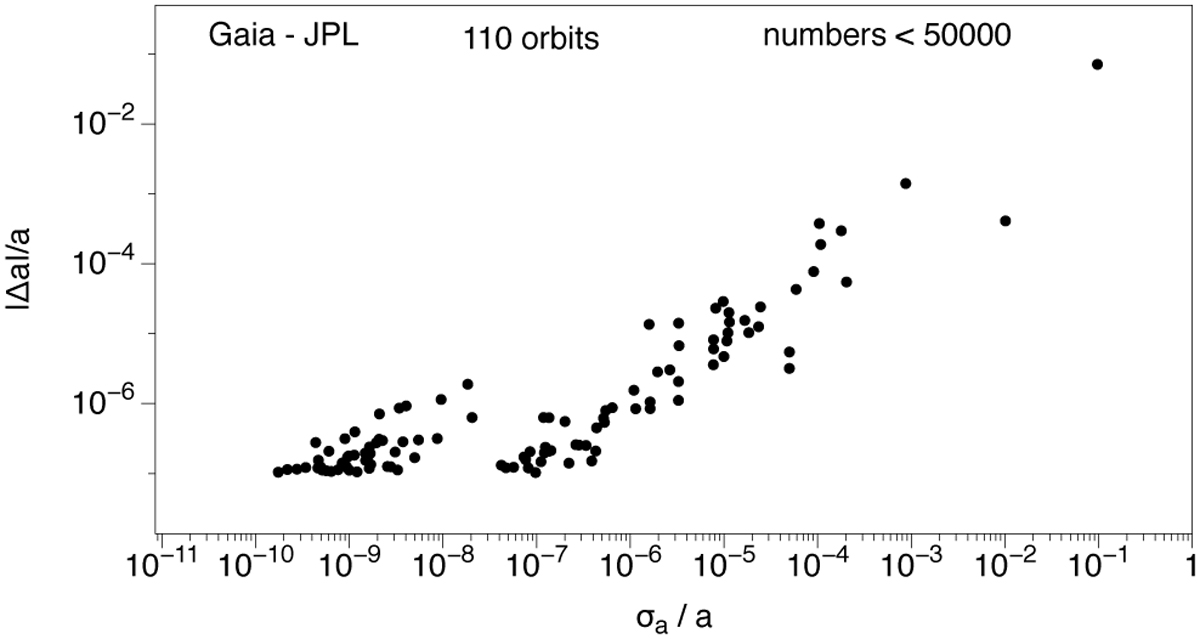
Anomalous differences in semi-major axis between the Gaia orbital solution and the JPL orbits. The plot shows the relative difference as a function of the Gaia formal uncertainty σa/a for all solutions with |∆a/a| > 1 × 10⁻⁷. The left group (σa/a < 5 × 10⁻⁸) is just the small statistical right tail of the distribution of Fig. 20 and is determined by the selection threshold for the plot. The group on the right with σa/a > 1 × 10⁻⁷ comprises solutions with a poor fit performance and is not an issue: these orbits could have been filtered out in the pipeline and were excluded from the delivery.
Current usage metrics show cumulative count of Article Views (full-text article views including HTML views, PDF and ePub downloads, according to the available data) and Abstracts Views on Vision4Press platform.
Data correspond to usage on the plateform after 2015. The current usage metrics is available 48-96 hours after online publication and is updated daily on week days.
Initial download of the metrics may take a while.


